Welcome to this installment of BirdCast Traffic Reports, posts describing northeastern US nocturnal bird migration traffic rates, as calculated from a completely automated pipeline of algorithms. The images you see in Traffic Reports present the migration traffic rate (MTR), direction of bird movement, and speed of bird movement.
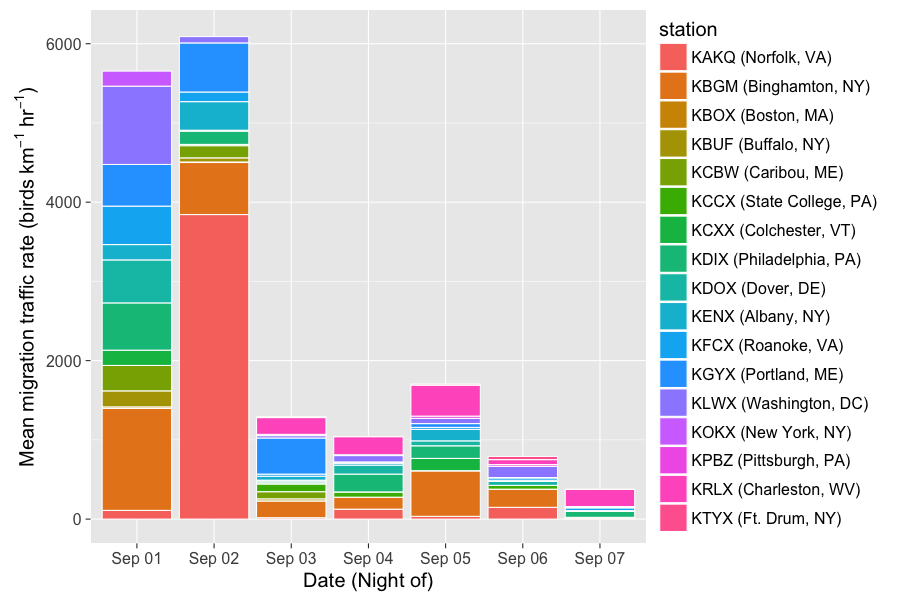
Migration traffic rates across the northeastern US from the night of 1 September to the morning of 8 September 2016. Note the large early period pulses on nights of 1 and 2 September.
Nightly Loops
1 September 2016
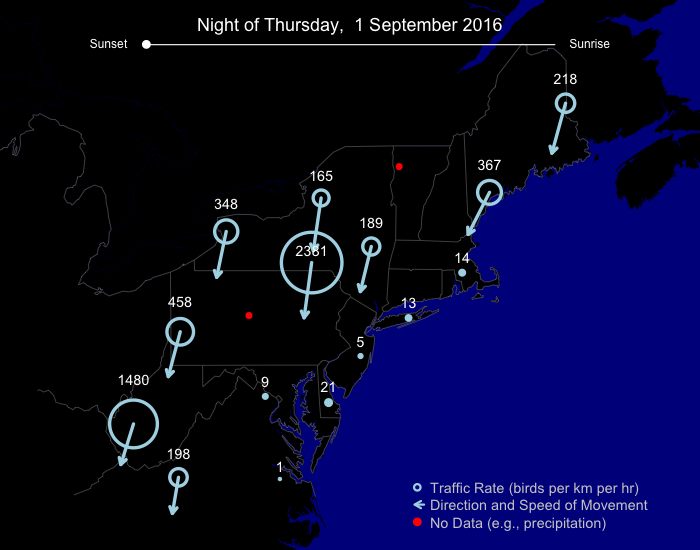
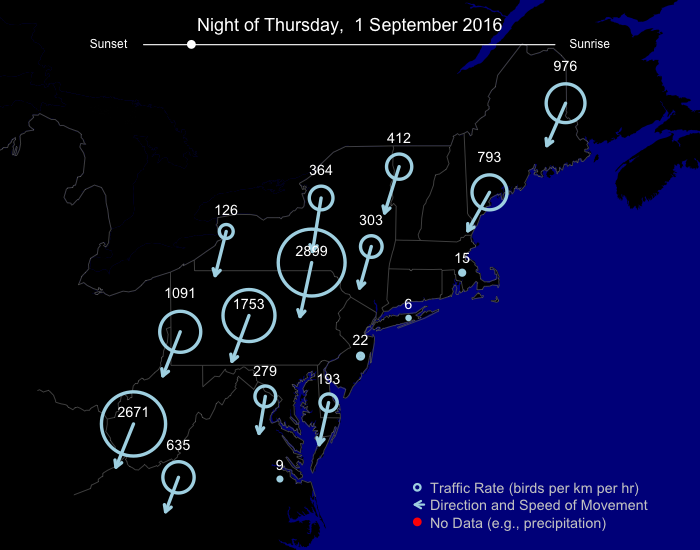
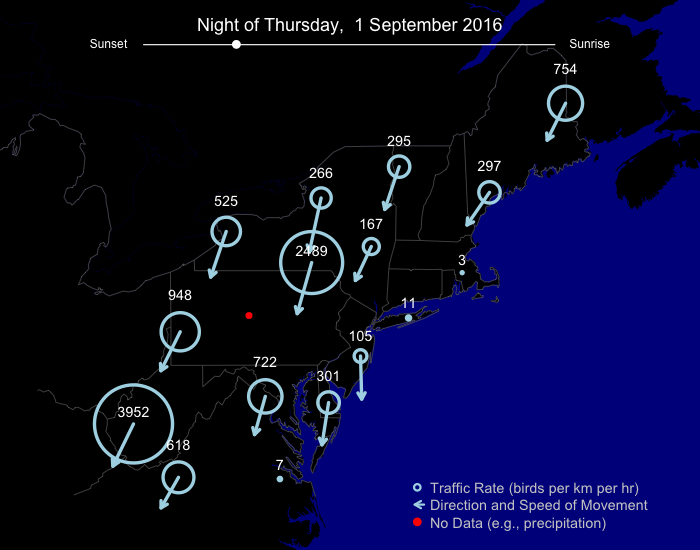
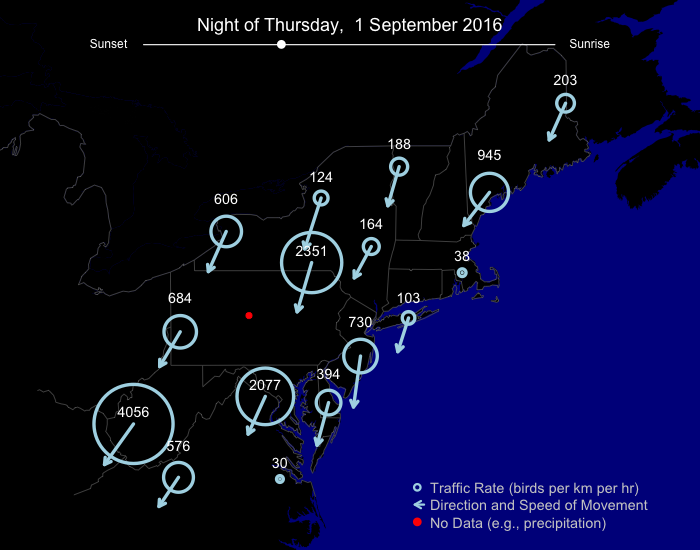
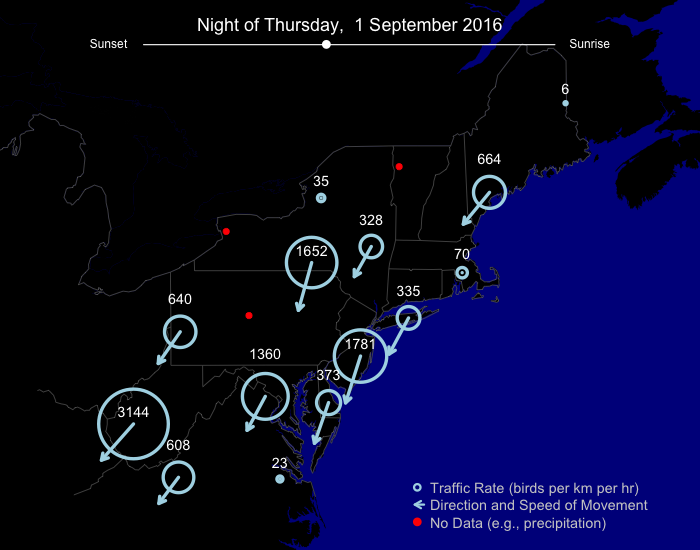
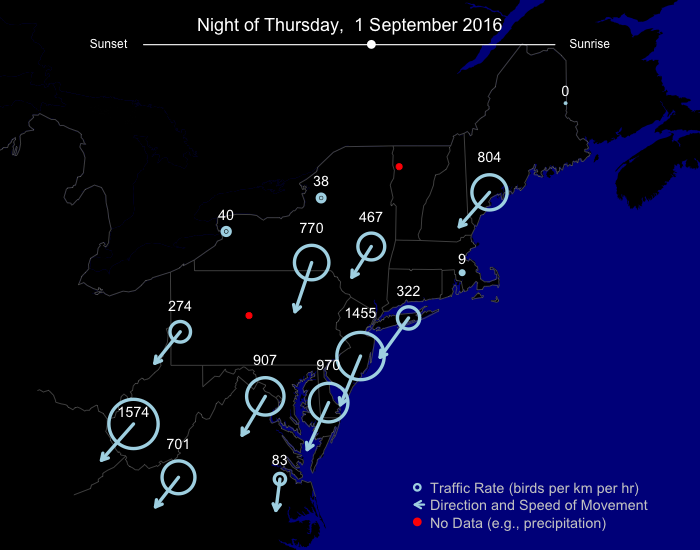
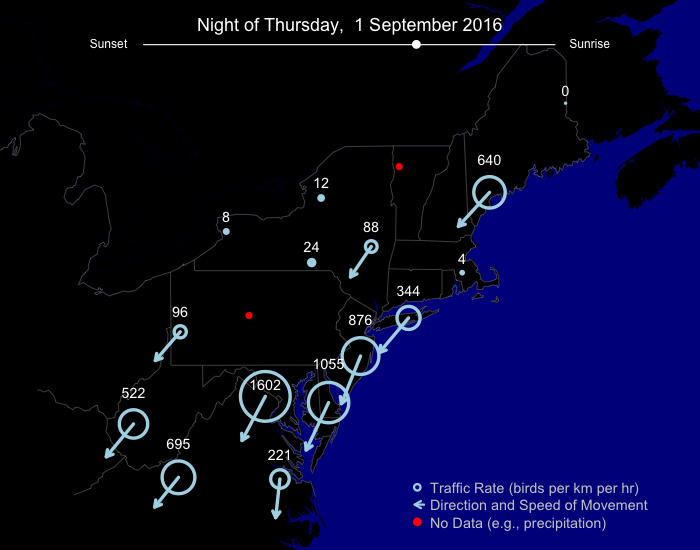
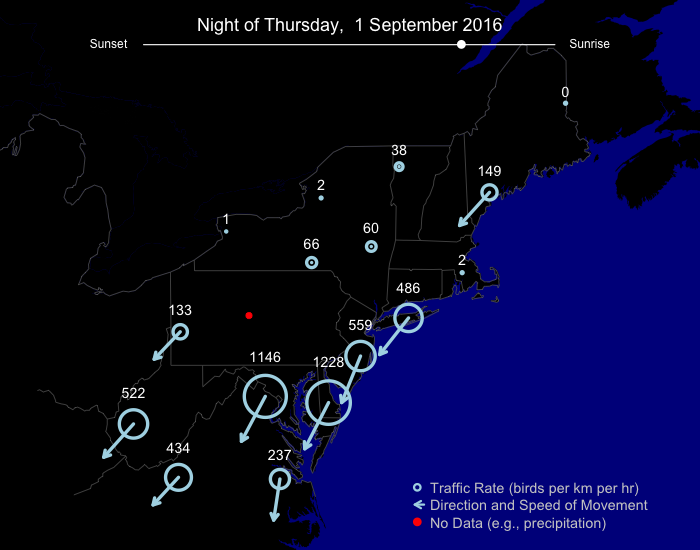
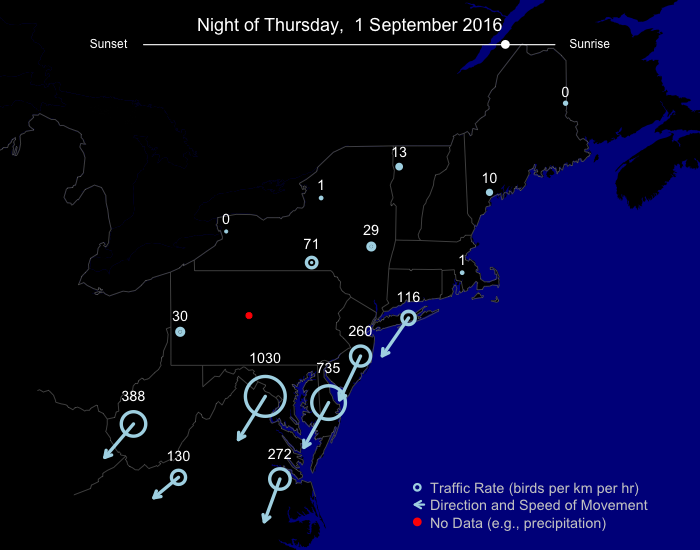
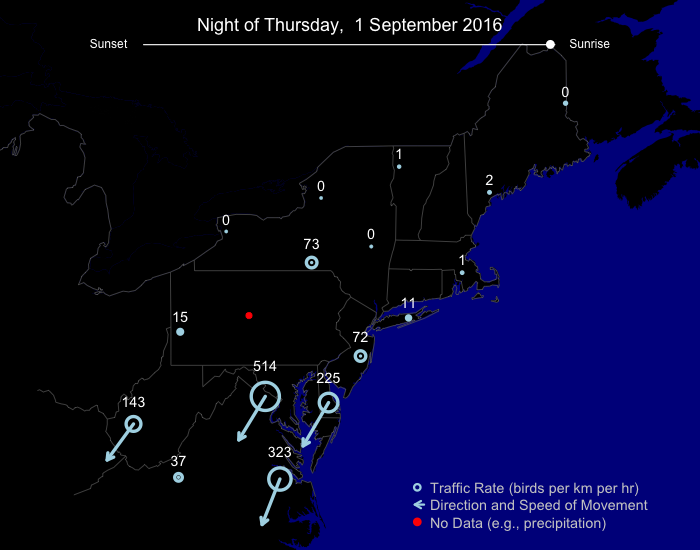
A large flight generally moving to the southwest occurred across the region, with the early night pulses in more northerly and inland locations followed by a later night southern, coastal pulse.
2 September 2016
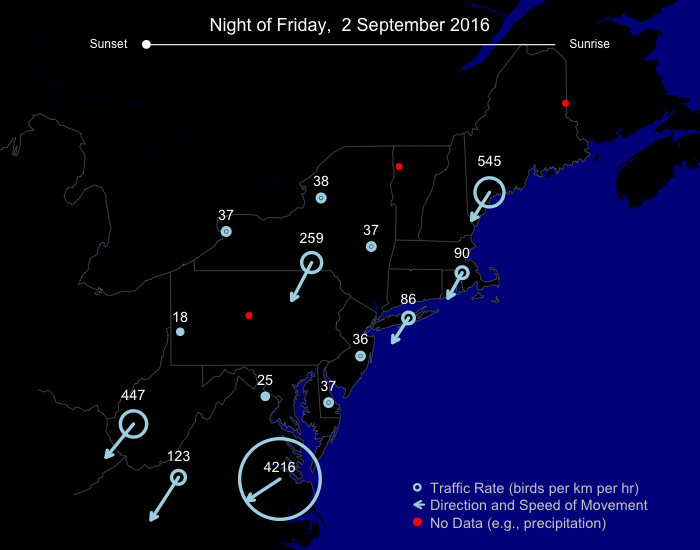
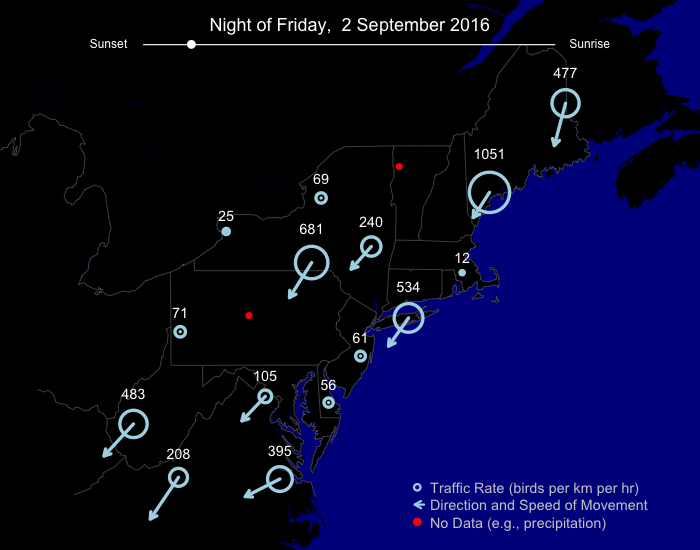
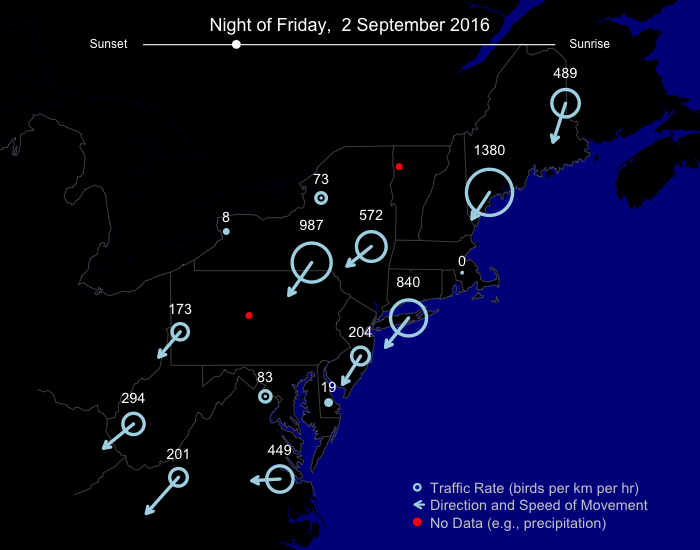
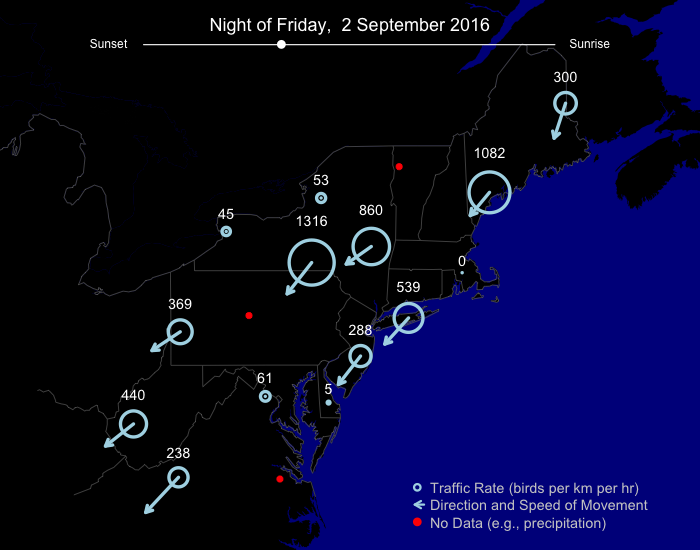
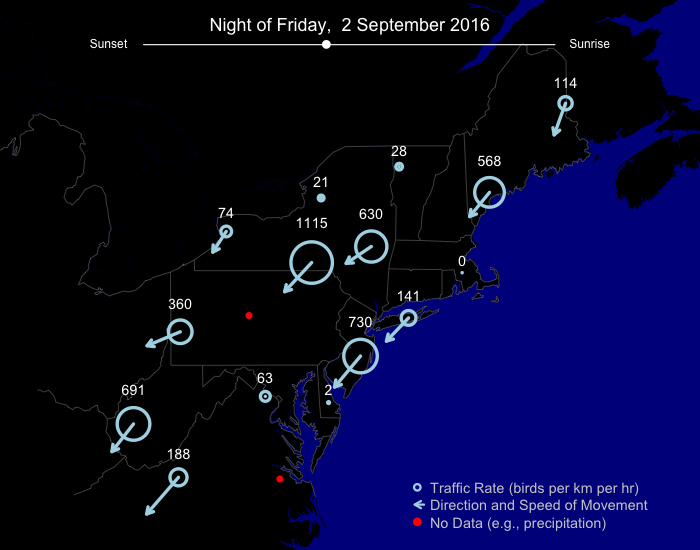
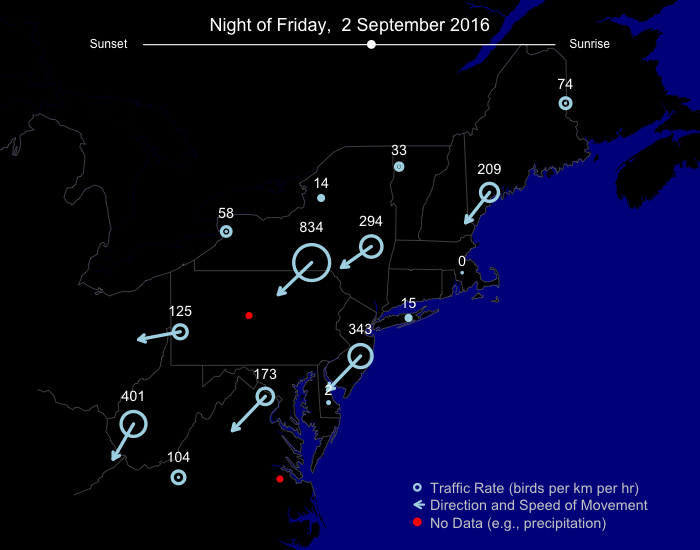
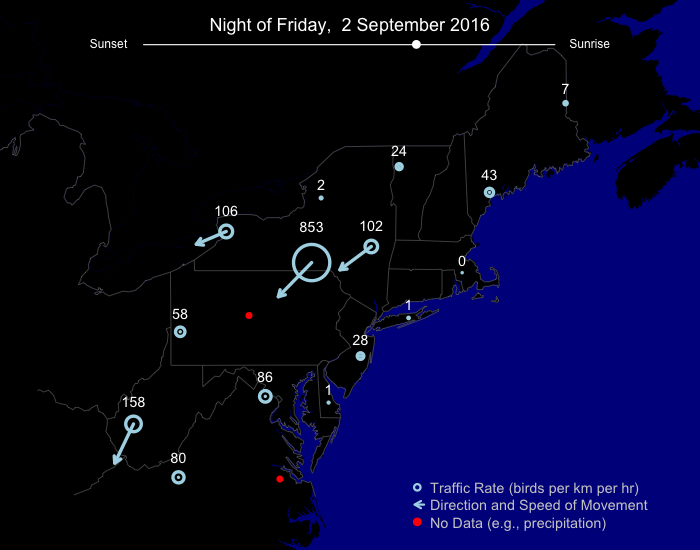

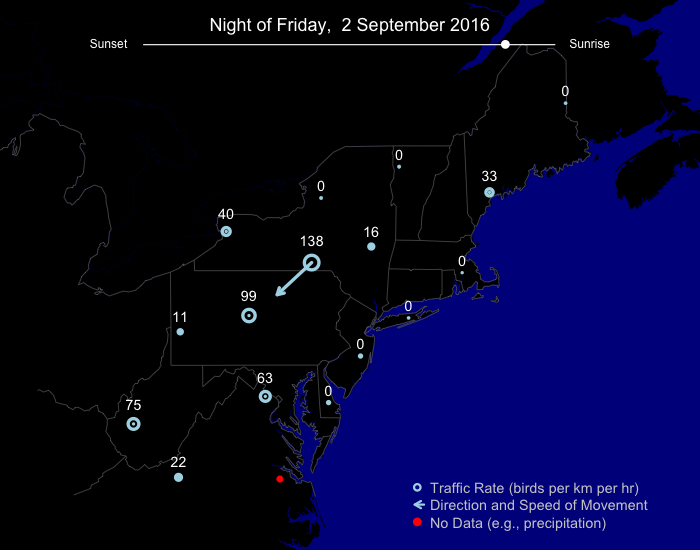
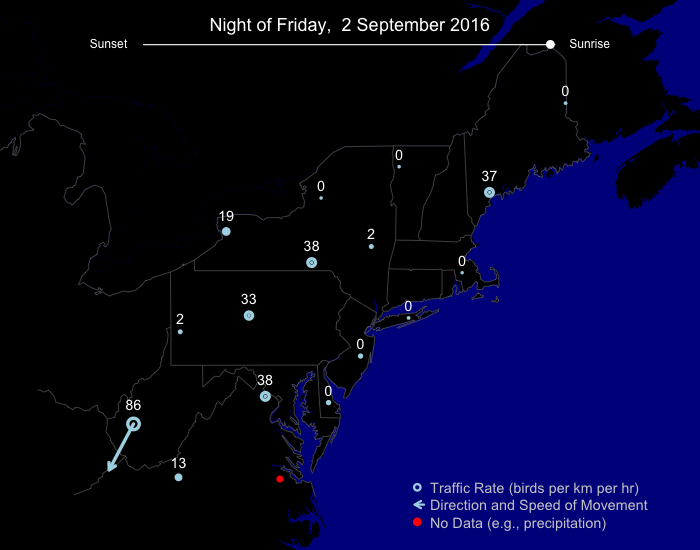
A similarly extensive but less intense flight occurred, relative to the previous night, with birds generally heading the similar southwesterly directions.
Recall that for both of these nights easterly flow associated with the soon-to-arrive Post-Tropical Cyclone Hermine was setting up in coastal areas, likely keeping birds that might typically migrate toward or across the ocean further inland and close to shorelines.
Background
Each night, from local sunset to local sunrise in the Eastern time zone, a BirdCast server downloads radar data from 16 stations in the northeastern US. These data are composed of every scan of the atmosphere made by these radars during this time period, with a particular focus in our case on radar reflectivity products representing the magnitude of targets (whether meteorological, like rain and hail, or biological, like birds, bats, and insects) at a given radar. A pipeline of algorithms extracts information from these radar data about birds, and the resulting bird-specific summary imagery is published daily in early afternoon eastern time (give or take).
The images you see in Traffic Reports present the migration traffic rate (MTR), direction of bird movement, and speed of bird movement. These presentations have not been reviewed by an expert, instead representing the automated output from several algorithms. Errors in the metrics are possible for approximately ~5-8% radar scans. These errors most frequently manifest as incorrect classification of precipitation or other non-biological information as birds by our automated classifier during nights with both migration and precipitation present.
For detailed information on the processing and quantification of radar data and the algorithms involved in this processing pipeline, please see our recent publication in Ecological Applications.