For our inaugural automated migration forecast and live migration map analysis posts, let’s take a quick look to see how the forecast maps compare to the reality that actually occurred!
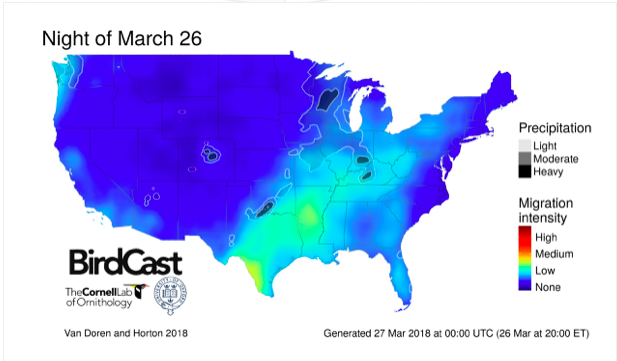
First, the forecast: for the night of March 26, we predicted low to medium intensity migration in Texas and portions of the lower and central Mississippi River Valley. Aside from a few other local areas of low intensity migration in the Pacific states and portions of the east, we predicted that migration scene would be generally quiet.
Next, the analysis of the “live” migration map: low to medium migration intensity occurred from southern and central Texas north and east into the lower Mississippi River Valley! These movements were predominantly to the north and north-northwest over Texas, Louisiana and Arkansas and to the north-northeast in the lower and central Mississippi River Valley, Ohio River Valley and portions of the Northeast, where some additional low intensity movements occurred.
Additionally, note that areas forecast to receive precipitation in the western Great Lakes correspond rather well to areas where migration was not observed on the live migration map.
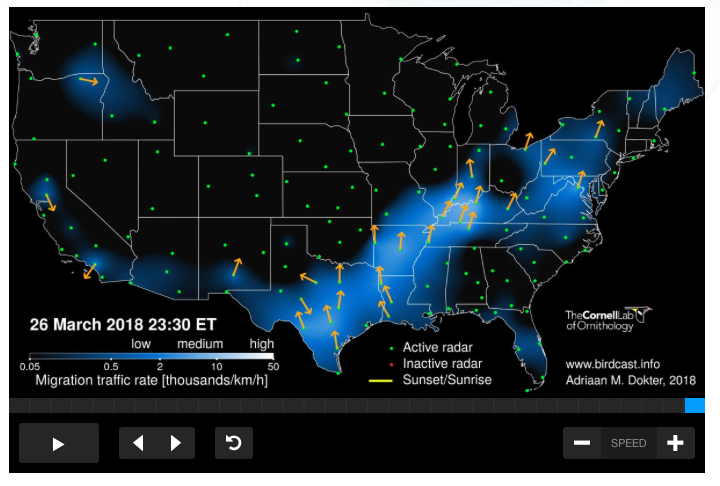
Finally, the interpretation for why what happened actually happened: the most intense areas of migration corresponded to areas of primarily southerly winds to the east of low pressure in Texas, Louisiana, and Arkansas in areas to the south of a stationary frontal boundary. Additionally, southerly winds to the south and west of strong high pressure over Maine facilitated the low intensity migration in portions of the Northeast.