The much anticipated day of the 2024 total solar eclipse arrived!
The BirdCast team was excited … and ready!
Please scroll down for updates!
Follow the celestially-driven, aeroecological events of today’s total solar eclipse as detected by the weather surveillance radar network operating in the contiguous US!
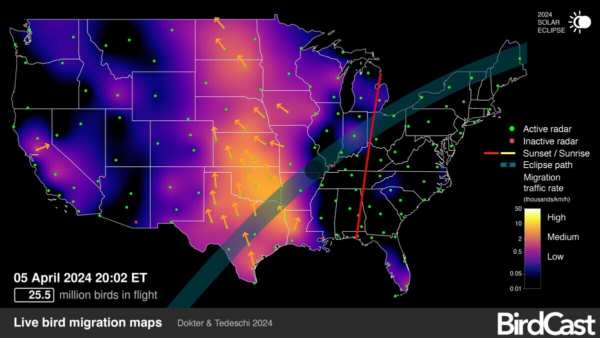
BirdCast will, again, monitor aerial animal behaviors during today’s eclipse from the perspective of what is happening to the numbers of animals above the contiguous US. And to try to capture these happenings for all to understand and to “see,” we have adjusted our live migration maps, monitoring ‘live’ the behavior of birds (as well as insects and bats in some areas!) in the atmosphere. Instead of the usual nocturnal only visualizations of birds’ movements in the atmosphere, during the total eclipse BirdCast’s ‘live migration maps’ will be enabled all day. We have adjusted the sensitivity in our processing and visuals to display the day-time activities of birds as well as any insects and bats that may be flying.
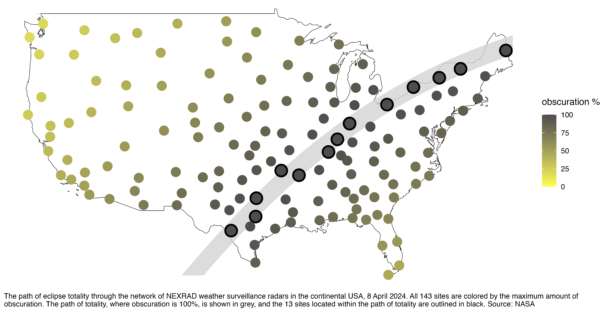
The eclipse display (a preview of which is below) will be active from 1pm to 5pm ET on Monday. There are 13 radars in the path of totality, where observers on the ground, and animals on the ground and in the air, will experience a total solar eclipse, with 100% obscuration of the sun by the moon.
With this year’s eclipse, we are expanding on our research from published in 2018. You will recall this paper, led by former postdoc Cecilia Nilsson, covered the 21 August 2017 US eclipse and showed that activity of insects and birds typically decreases approaching totality, with some radars showing a short burst during totality. The change in light levels, and presumably temperature and wind, were sufficient to suppress many diurnal (daytime) behaviors but insufficient to initiate many nocturnal (nighttime) behaviors.
We’re curious to see what will happen this year – early April is a period of active bird migration, which occurs mostly at night as all of your reading this probably know, with birds motivated to arrive as early as possible to their breeding areas; and the timing of this eclipse comes relatively early in the season for large numbers of insects and bats to be active (especially in the northern US given winter-like conditions!), so the observed patterns and behaviors may well be very different from those we saw in 2017.
Previously updated details, 8 April!
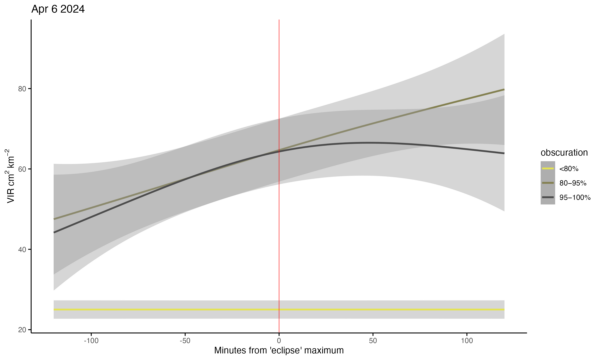
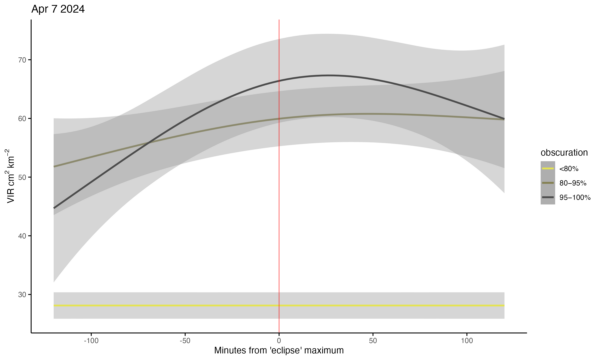
In preparation for the radar data soon to be gathered and analyzed for today, 8 April, we present below the history of two previous days’ worth of biological activity from 143 radars in the contiguous US to set the stage for comparison: 6 April (the top figure) and 7 April (the bottom figure). You’ll notice a measure of biological activity on the y-axis, and time on the x-axis, in this case highlighted by a red, vertical line to represent the time of totality. And importantly, you’ll notice three different color lines representing radars from different areas of the eclipse’s predicted path of obscuration: less than 80% obscuration (67 radars), 80-95% obscuration (44 radars), and 95-100% obscuration (32 radars), corresponding to the visual you see above. The patterns of increasing biological activity as measured by VIR, vertically integrated reflectivity, is quite distinct among these locations in the two hours preceding the time of day representing the eclipse for each of these radars. So, too, the pattern of decline is quite distinct. What patterns will we see today? How will they differ from these patterns? As a starting hypothesis – a null hypothesis if you will – we expect, based on our 2018 paper, that the pattern we will see will be one of a dip – a decline, a drop in numbers – of biological activity at totality; in other words, there will be no difference between the pattern we see this year and that pattern we detected from the 2017 eclipse. Come back later today to check!
Updated details, 10 April!
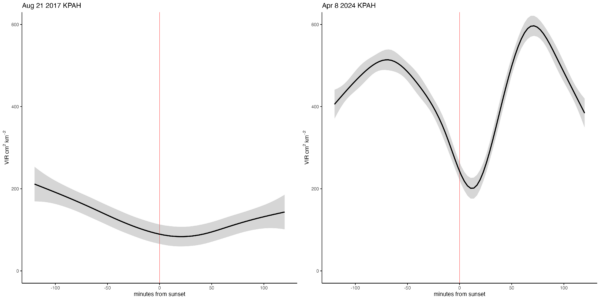
One of the first aspects of the analysis of the 2024 data involved a comparison of the one radar station operating during 2017 and 2024 eclipses – KPAH in Paducah, Kentucky! And, drum roll please, the first cursory analyses show that a markedly higher measure of biological activity (y-axis) occurred in 2024 (see the right hand figure) relative to 2017 (left hand figure). Yet, importantly, the pattern of a dip during the period of totality, represented by the red vertical bar in the middle of the x-axis, that we saw during 2017 was even more striking in 2024! This translates to a simple observation – the eclipse’s darkened skies, decreased temperatures, and other associated attributes suppressed diurnal behaviors of aerial animals! We did not see the pattern typical of nocturnal exodus of migrating birds that occurs 30-45 minutes after sunset. There will be more to say here, but our first looks at the pattern confirm our results from 2017.