FAQs:
- How does weather radar work?
- How do radar ornithologists remove ground clutter (nearby trees, buildings, and objects) from radar data?
- How do radar ornithologists remove weather systems from clouds of birds?
- Are there returns from aircraft on weather radar?
- Is all of the continental U.S. covered by radar?
- How is radar data converted into an approximate number of birds?
- When will radar be able to distinguish between species?
- Why aren’t Canada and Mexico covered by BirdCast?
- What role do subrefraction and superrefraction play in radar data?
–
How does weather radar work?
Radars do two things: “emit” and “listen”. What are radars “listening” for? NEXRAD systems determine the time taken for waves to return to their sensor and detect the incredibly small changes in the frequency of the returned wave. Using these two pieces of information, NEXRAD systems are able to determine where objects are and at what speed these objects are moving relative to the radar site.
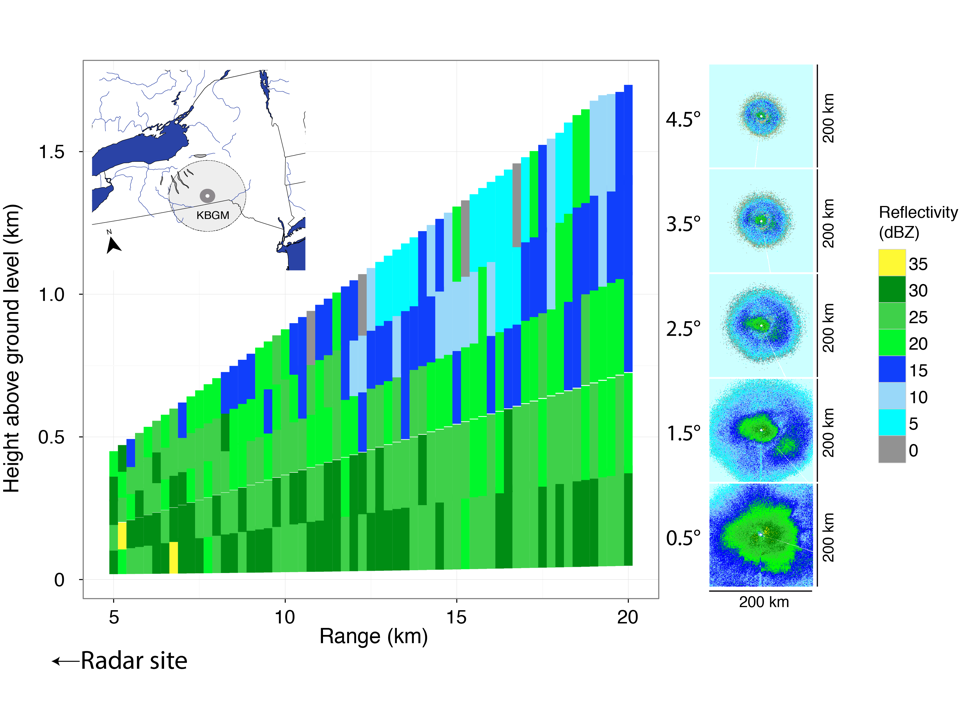
The above graphic shows returns from the Binghampton, NY radar site from scans at a beam elevation of 0.5, 1.5, 2.5, 3.5, and 4.5 degrees above ground. Because the radar looks slightly upward, the further away from the radar, the higher the beam probes the airspace—steeper elevations give us information on the atmosphere at higher heights.
From these elevation scans, we can create vertical profiles of the atmosphere surrounding the radar site. Scans are done at various angles above ground, starting at 0.5° and going upwards. These angles allow scientists to gain information about the height of objects in the atmosphere. Meteorologists find this function especially important for determining the severity of a weather system; the thicker the cloud (or, the more angles of emission the cloud returns waves for), the more likely a severe storm is possible. In turn, the BirdCast team can use these angles to determine how high birds are flying nearby.
Aside from the stereotypical radar imagery shown in most TV broadcasts, NEXRAD systems also create other products (i.e., products illustrating storm velocity, precipitation totals, and vertical wind profiles) to aid professionals in their interpretation of atmospheric activity. We at BirdCast use many of these products while also developing our own—ones more attuned to tracking birds.
–
How do radar ornithologists remove ground clutter (nearby trees, buildings, and objects) from radar data?
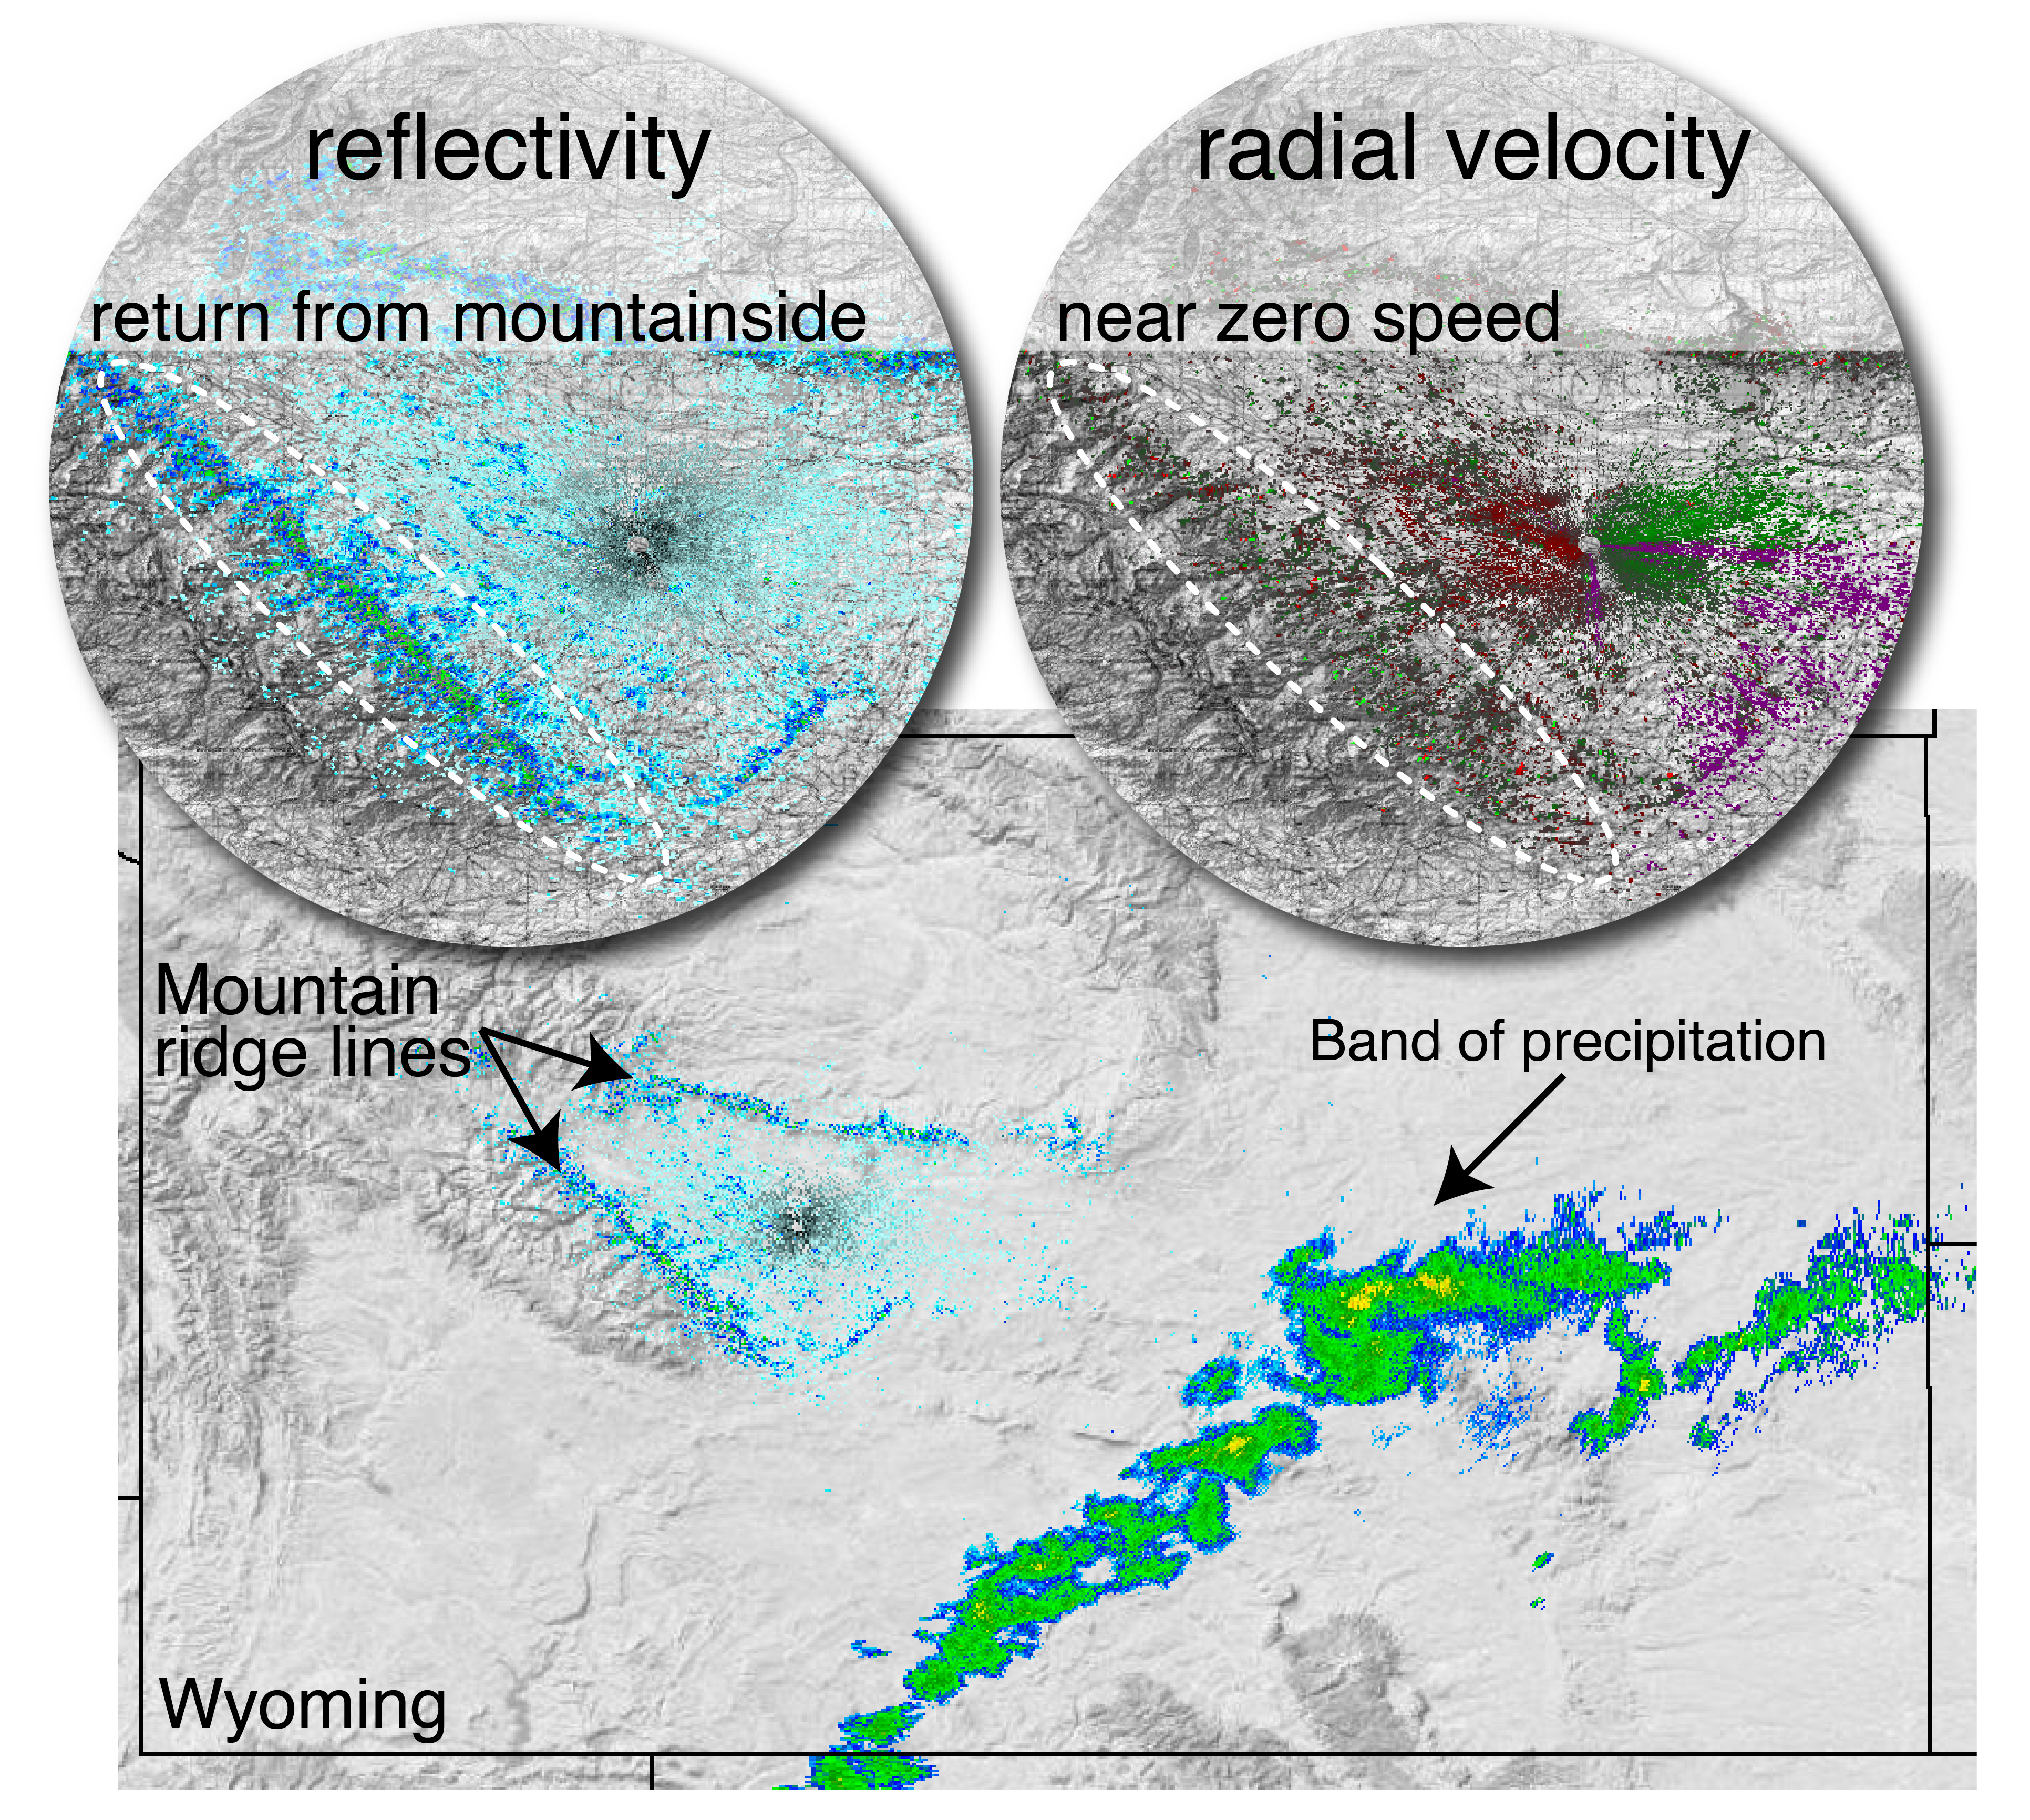
Ground clutter, wave reflections from grounded structures like wind turbines, buildings, and even trees, have been muddying radar observations since the technology’s inception. Luckily, most of these echoes are quickly removed with highly sophisticated algorithms. However, sometimes ground clutter slips through these algorithms, and we, just like meteorologists, work to remove these signals. A key feature to look for when trying to identify ground clutter is the general absence of movement relative to the radar site. Reflected radio waves from ground clutter do not experience the same shift in frequency as moving objects, making it much easier to sift out these data. We use a radar product called radial velocity to separate stationary objects’ returns from moving objects’. In addition, radial velocity helps us determine the general speed and direction of birds.
–
How do radar ornithologists remove weather systems from clouds of birds?
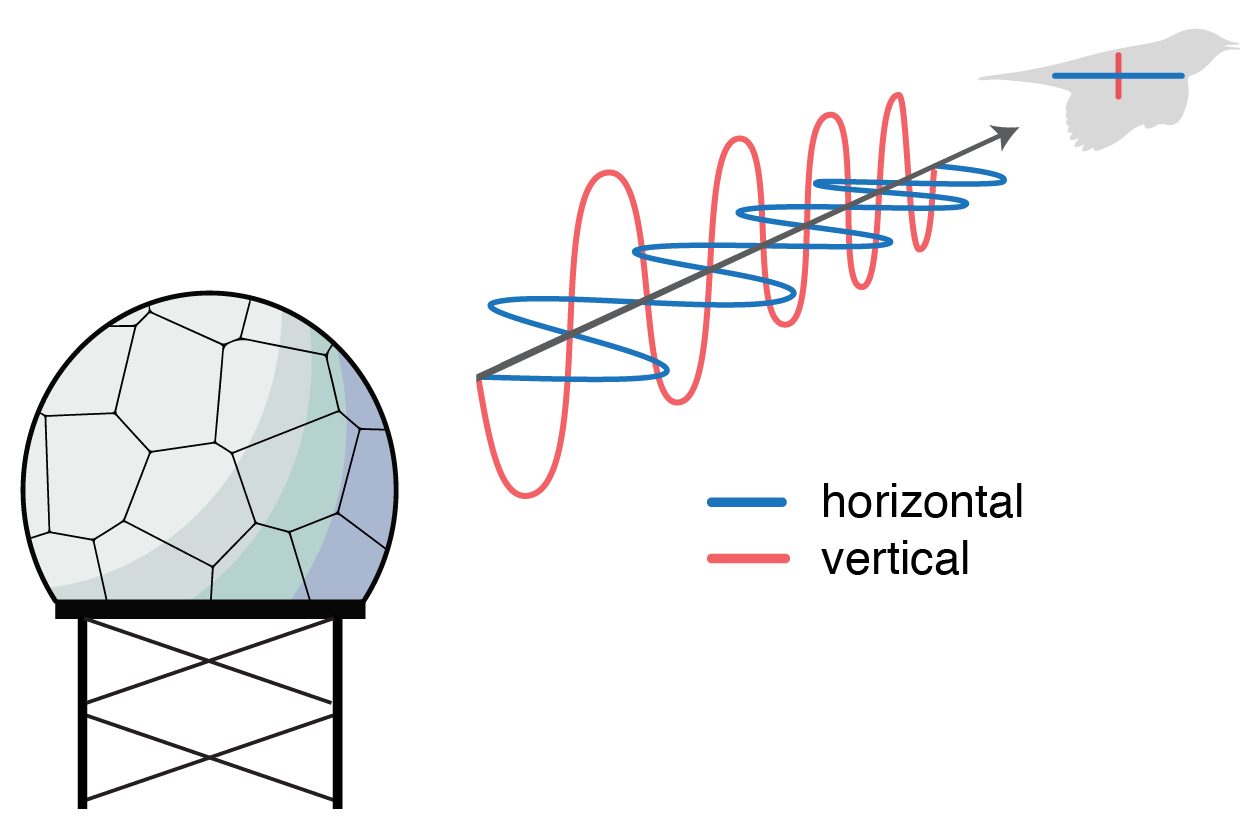
Dual-polarization technology allows NEXRAD systems to emit and receive radio waves at two angles instead of one.
In 2013, the NEXRAD network went through a significant upgrade, changing the existing WSR-88D radars to include dual-polarization (or dual-pol, for short). This upgrade allows radars to emit along two planes of polarization (see figure above); historically radar waves were emitted in the horizontal direction along one plane of polarization. This upgrade adds another dimension and helps to resolve the approximate size, shape, and variety of objects within the atmosphere.
| One of the new products that resulted from the 2013 updates is a field called “correlation coefficient.” Correlation coefficient indicates the extent to which the signals in the horizontal and vertical polarization vary synchronously over time. Rain clouds—made up of near-uniform cloud droplets—have a correlation coefficient value close to 1. While meteorological phenomena have high correlation coefficient, traveling birds do not; they are often unevenly sized, oriented differently, and show more complicated (body) movements than rain droplets (i.e., mid-flap versus coasting). As a result, correlation coefficients for birds—along with other non-meteorological objects—are much lower, almost always ranging below 0.9 (see below).
Aeroecologists can use low correlation coefficient values to find non-meteorological data and effectively filter out weather contamination. |
 The above graphic illustrates the filtering of precipitation from radar data using correlation coefficient values (shown in this graphic as “CC”). |
–
Are there returns from aircraft on weather radar?
Weather radars do “see” aircraft but are specifically programmed not to display them. This filtering happens almost immediately, so the data that we receive do not contain any information about aircraft.
–
Is all of the continental U.S. covered by radar?
Although the Next Generation Radar (NEXRAD) system has an impressive 143 radar sites in the continental U.S., topographical features—like the tall Rocky Mountains—make it nearly impossible to have this entire area monitored by weather radar.
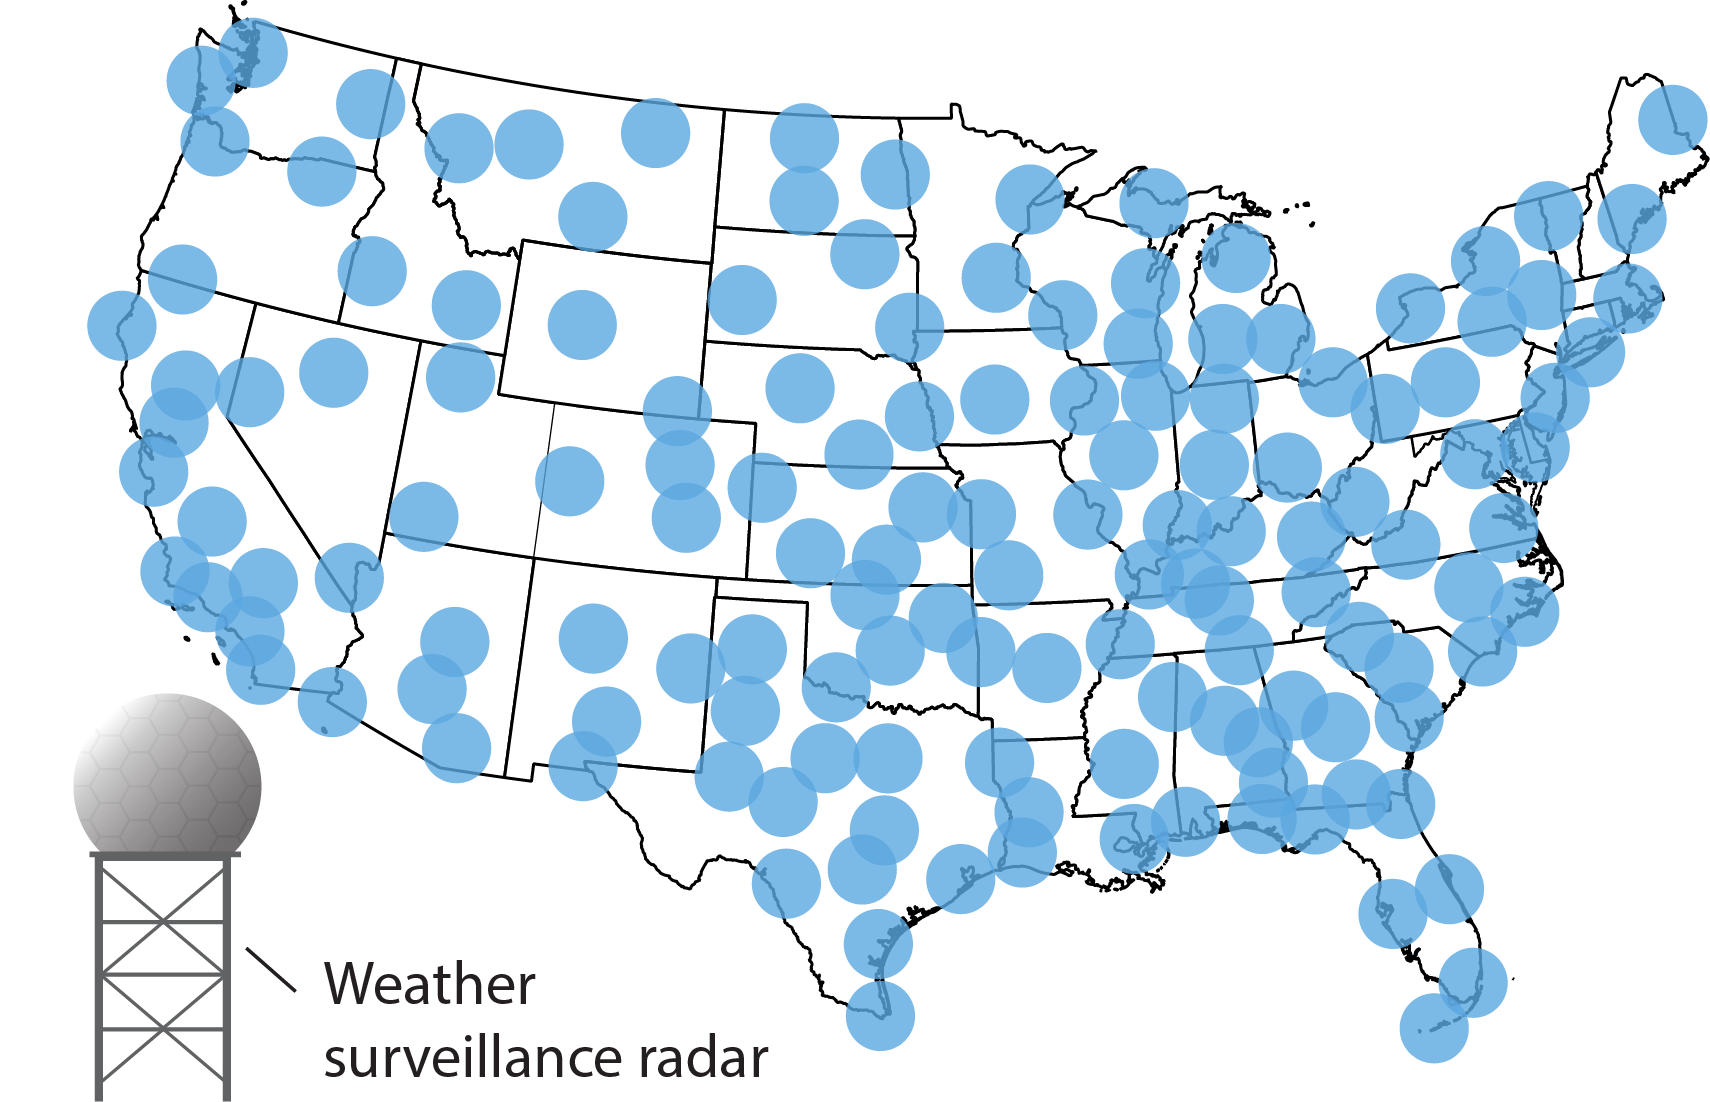 With this in mind, we use a variety of methods to interpolate our estimates of migratory activity over these uncovered areas.
–
How is radar data converted into an approximate number of birds?
The strength of a radar return is measured by a metric called reflectivity factor (Z) and is typically measured on a logarithmic scale (dBZ). The higher the dBZ, the greater the amount of energy returned to the radar. We also use these reflectivity factor values to estimate the number of birds in the airspace. Just like with meteorological phenomena, the higher the dBZ, the higher the bird density.
However, dBZ does not give us a precise number of objects; we have to take additional steps to come up with a head count. One large bird can show up with the same signal strength as several smaller birds. Many different species—and different sizes—of migratory birds can travel at the same time, without us being able to distinguish them. Although radar data can tell us a lot about migratory behavior, we are still unable to precisely determine bird species from radar alone. Therefore, we need to use an assumed average bird size when converting reflectivity into the number of birds.
–
When will radar be able to distinguish between species?
Although advances in radar technology have aided in our differentiation of birds from other fliers, more innovation is still necessary before we’re able to distinguish unique species of birds. Without verification from other data sources, radar data cannot determine specific species in clouds of migrating birds, and its strength lies in the quantification of higher level general patterns that apply to many species.
However, we can learn a lot by integrating your eBird observations. Your records are applied to help hypothesize the specific makeup of radar data—and to even further verify our bird identification algorithms.
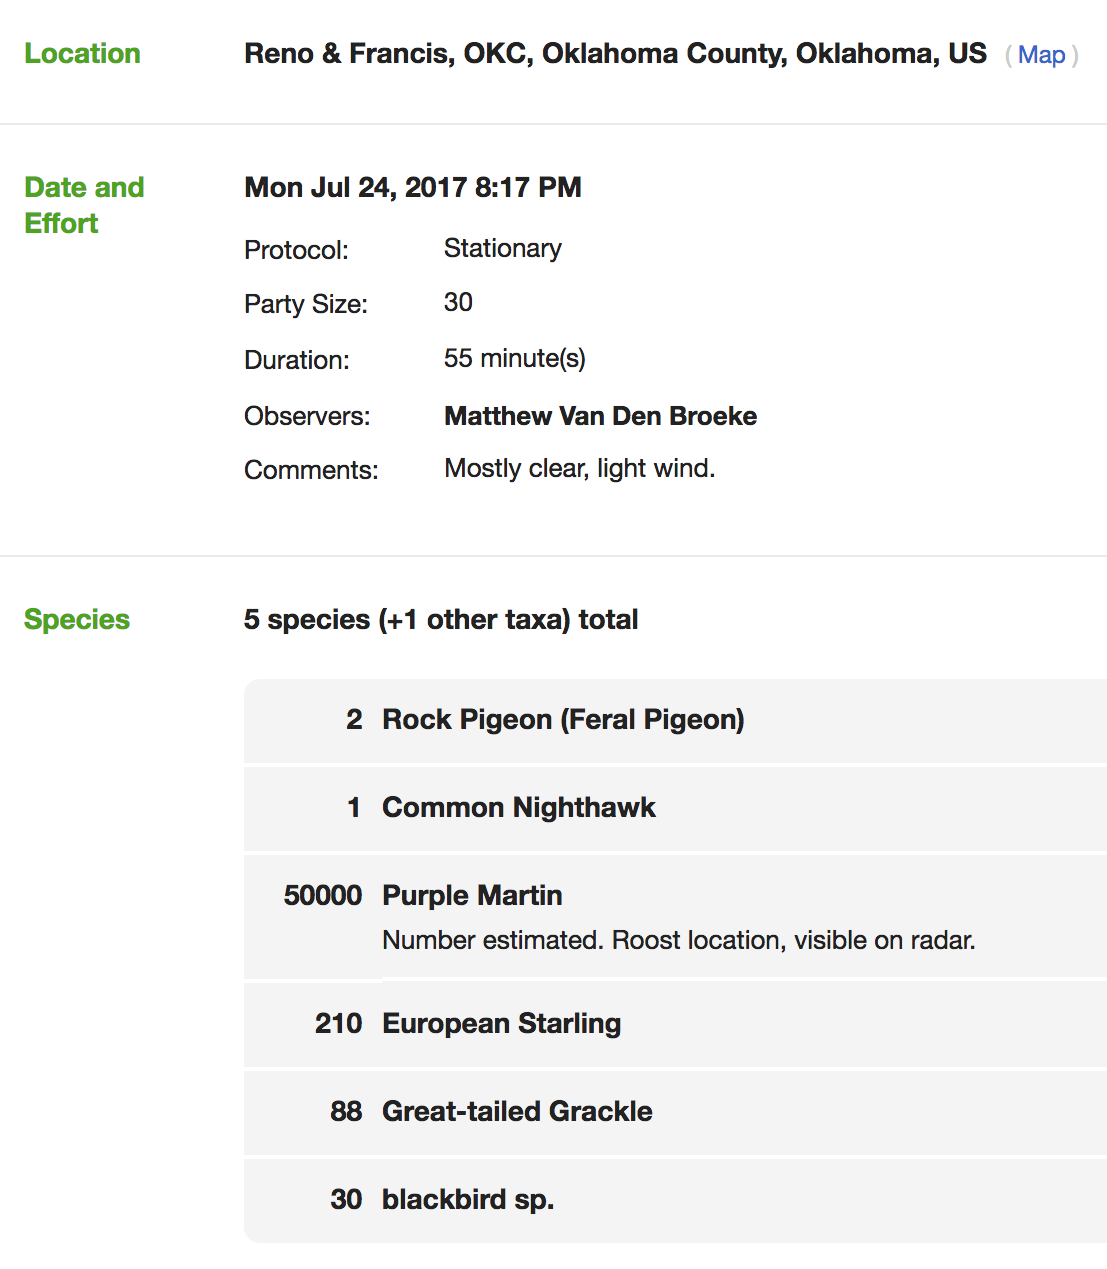 Van Den Broeke’s eBird checklist from July 24th, 2017. |
 Look to the upper left to see 50,000 Purple Martins caught on radar in Oklahoma City. (Base reflectivity radar imagery from July 25th, 2017.) |
| Here is an excellent example of how we can ground-truth the radar signatures. Matthew Van Den Broeke and a crew of 30 other birders had a monumental day. Right these birders’ heads, an estimated 50,000 Purple Martins came to roost for the night in Oklahoma City. Checklists like these help radar ornithologists to “ground-truth” what they see in radar imagery. The July 25th, Van Den Broeke’s the martins were detected by Oklahoma City’s NEXRAD radar as they left their nightly roost, taking to the sky to forage for the day. | |
–
Why aren’t Canada and Mexico covered by BirdCast?
It would be great to extend these maps to Canada and Mexico, but data exchange policies and the real-time data connections don’t currently allow that. We’re hoping in the future to gain access to the archives of radar data in other countries so we can create graphics for birdwatchers worldwide!
–
What role do subrefraction and superrefraction play in radar data?
Subrefraction and superrefraction are two phenomena that change beam directions in the atmosphere. Both describe the “bending” of radar waves in unusual ways: subrefraction is bending upwards more than expected; superrefraction is bending downwards more than expected.
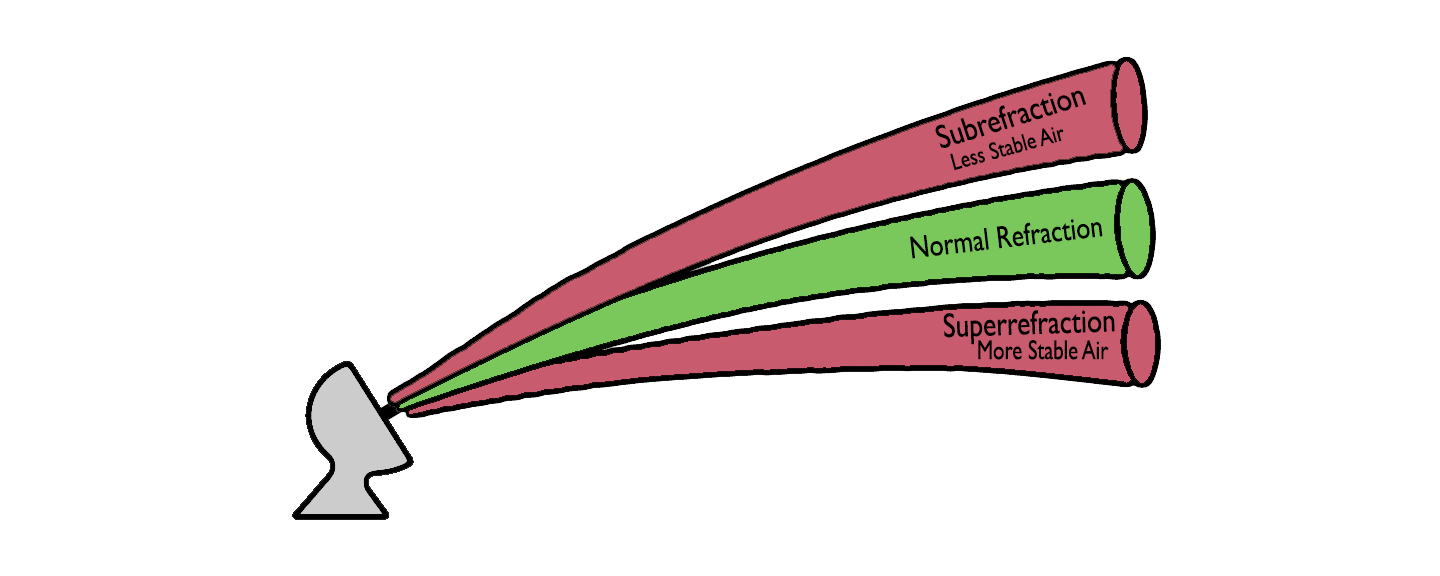
Subrefraction occurs when the atmosphere becomes less dense with height at a greater than average rate (i.e., density decreases by 5 kg m-3 instead of 1 kg m-1). These less dense conditions make for a less stable atmosphere and allow for radar beams to bend less than normal and “overshoot” airborne objects. For example, far away weather systems may not be detected if a subrefraction is occurring; the beam will be too high at the location of the storm. Subrefraction usually results in reflectivity lower than expected values, because subrefracted radar beams are higher above the ground and may miss atmospheric activity. Due to this phenomenon’s infrequent nature, subrefraction rarely plays a significant role in the BirdCast team’s observations and calculations.
Our analyses are currently based on vertical profiles that use data up to 35 km from the radar, and at these distances refraction effects are very small. It is mostly when looking at radar imagery at very far distances that refraction effects may become obvious.
On the flip side of refraction anomalies, superrefraction is still a rare but slightly more common form of radar beam “bending.” Superrefraction occurs when the atmosphere becomes less dense with height at a smaller rate than average (i.e., density decreases by 1 kg m-3 instead of 5 kg m-1). This type of density structure leads to a more stable atmosphere and is caused by an “inversion” layer—a portion of the atmosphere where temperature increases, rather than decreases, with height. Inversions are somewhat common phenomena right after sunset, especially when coupled with a cloudless sky. (It is important to note that not all inversions cause superrefraction, but an inversion layer makes these events more common.) When radar waves hit inversion layers, a portion of the beam may reflect off it towards the surface of the earth, leading to lots of detected ground clutter signals (see above).
While subrefraction can cause us to miss distant phenomena, superrefraction sometimes allows us to see even phenomena like bird migration at even further distances than expected. Superrefraction is not always helpful, though. Sometimes the radar bending is so severe that reflected beams hit the ground and provide returns from the surface of the earth. In these situations, the radar data usually indicate that the object is not moving; and as a result, we can filter out these data.
–
To learn more about our research team, check out our BirdCast staff bios here.