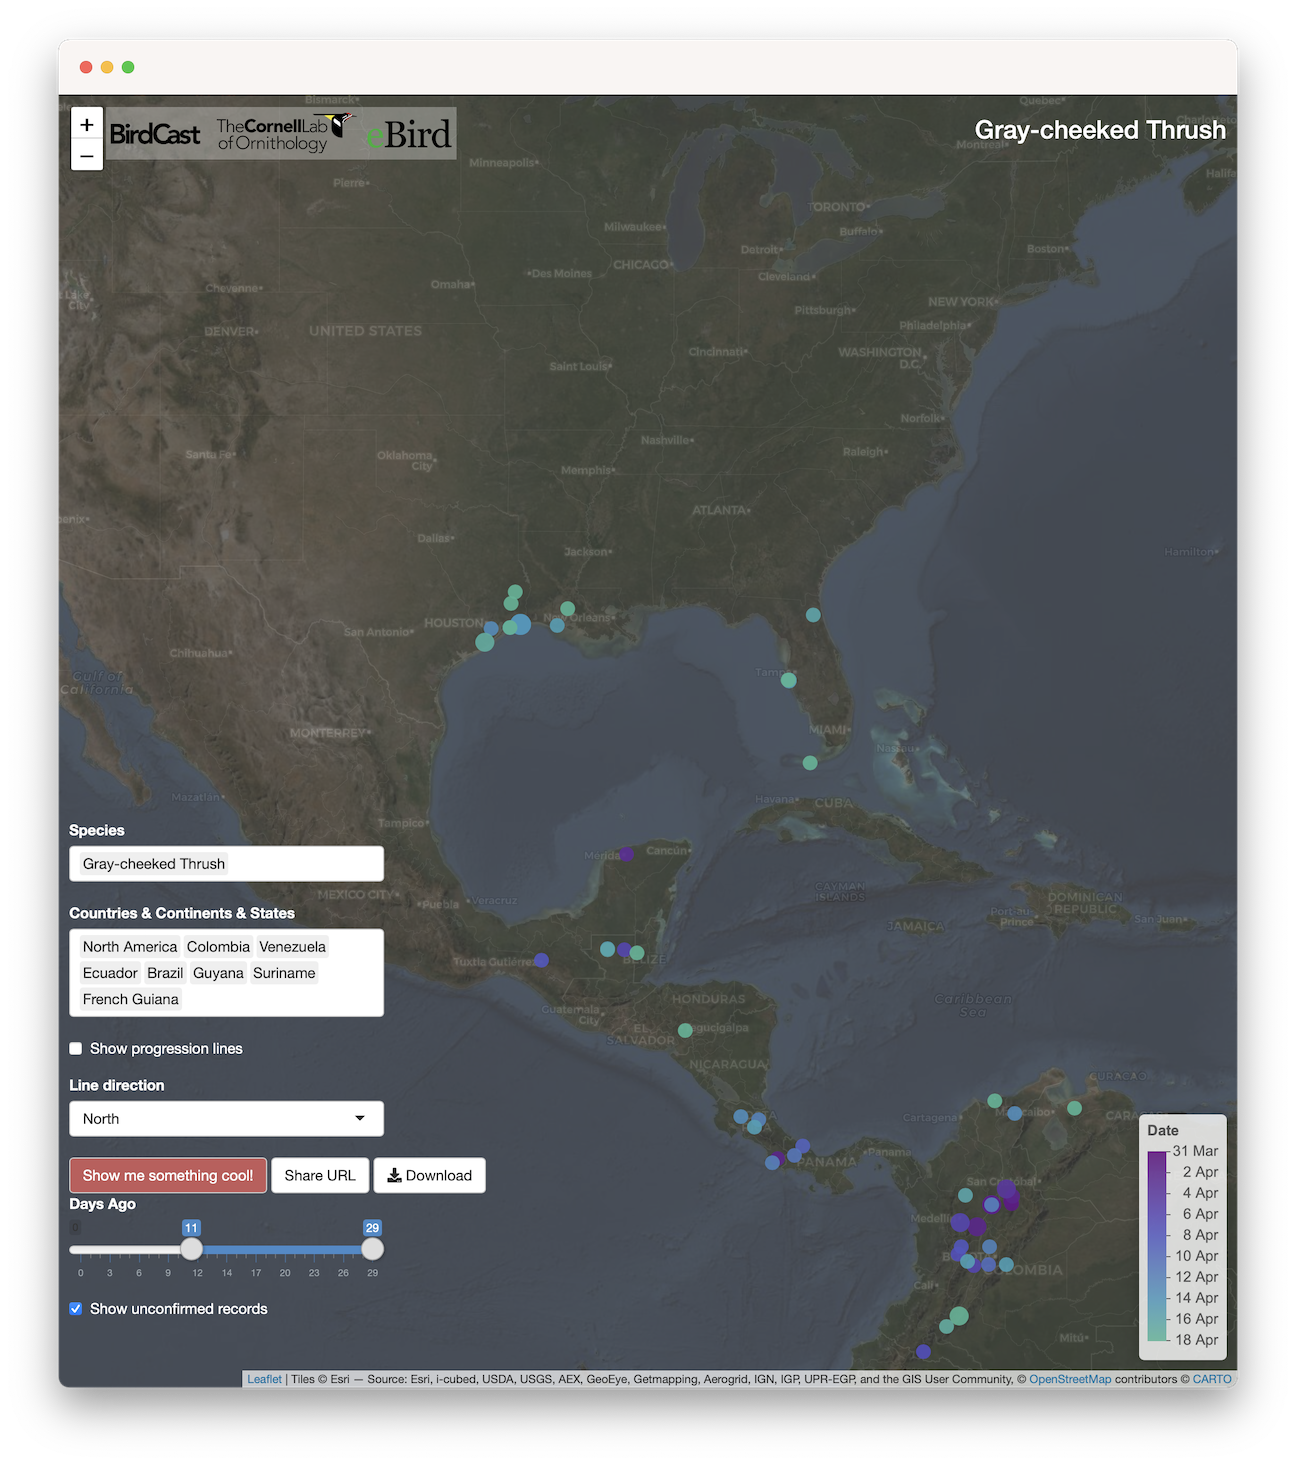
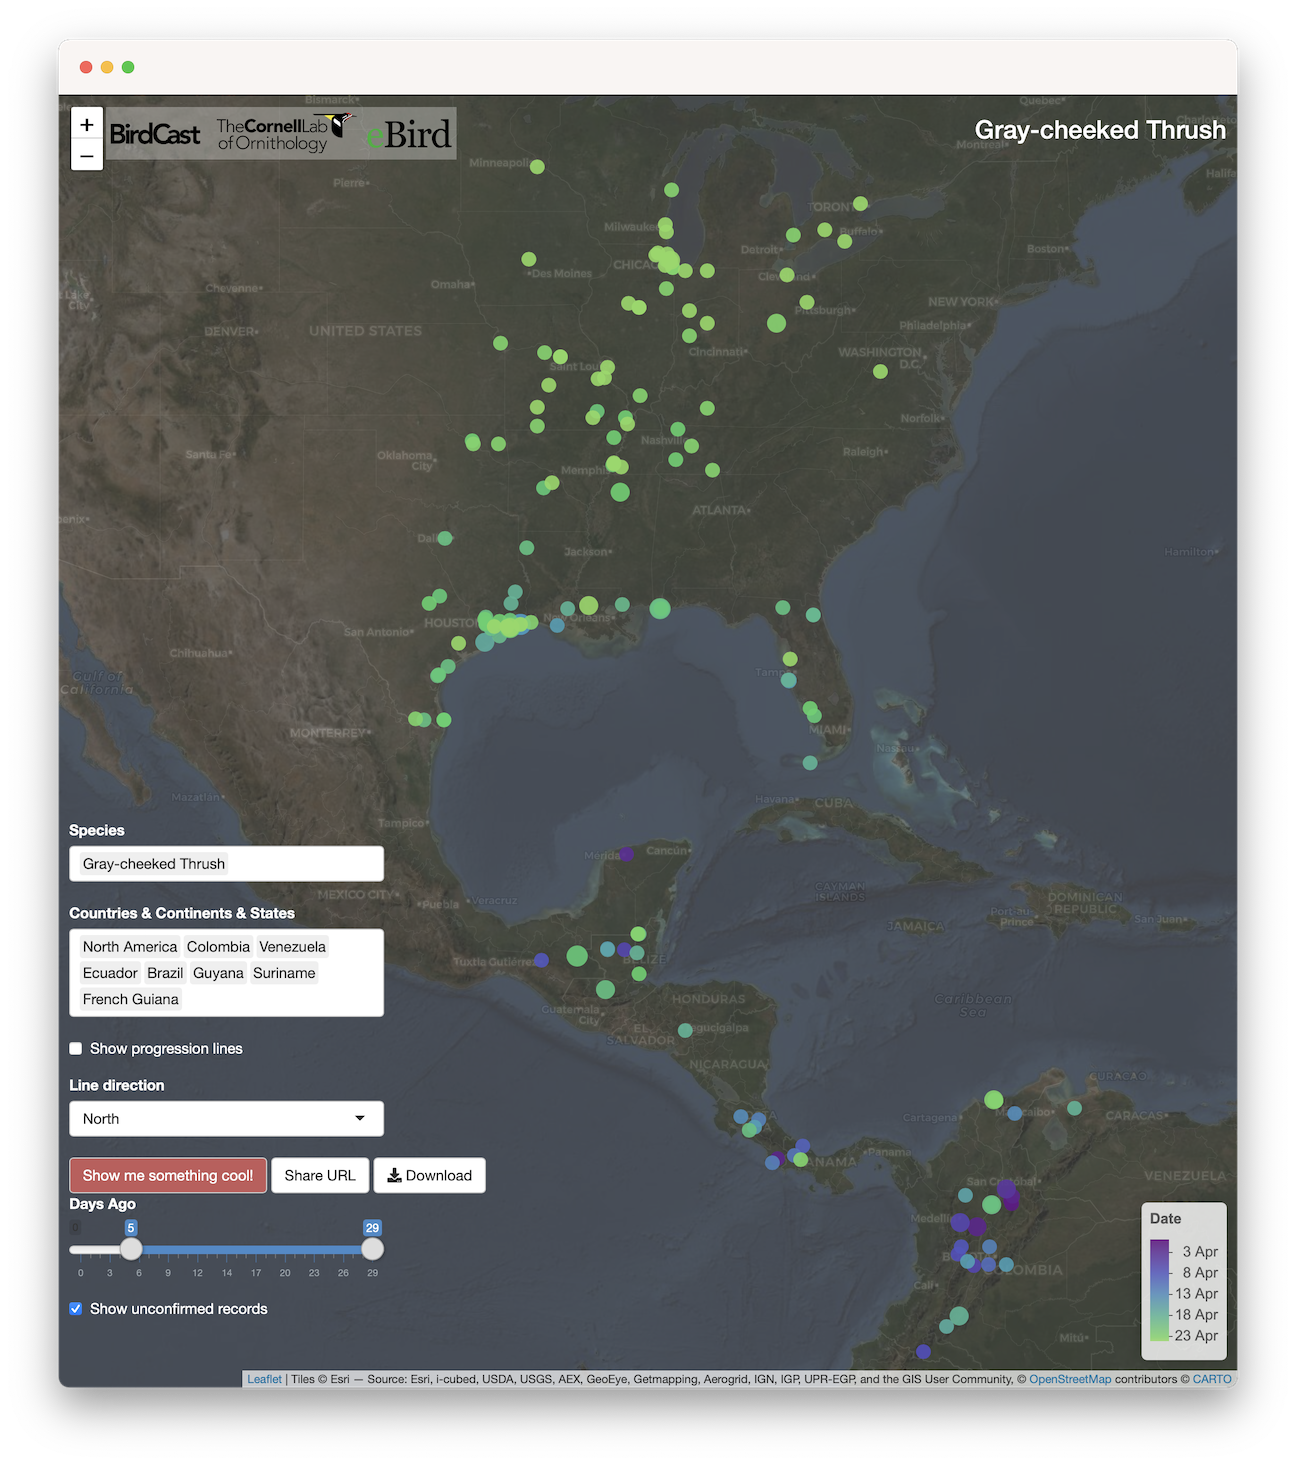
Whenever the BirdCast team notices a pattern that, though somehow familiar, is striking in its power to represent some broad underlying conditions, we try to provide some greater detail to explain what might be causing the pattern. During a recent review of April species arrivals, we noticed an interesting pattern of Gray-cheeked Thrush eBird observations. 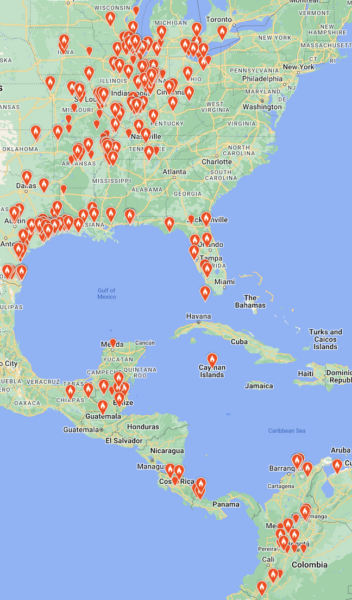 This pattern (to the left), depicting reports from northern South America north almost to Canada, is noticeably skewed to occurrences in the Mississippi River Valley and Upper Midwest, generally an area east of the Great Plains and west of the Appalachians, and particularly striking in this species’ near complete absence east of the Appalachians (i.e. except for Florida). Gray-cheeked Thrush occurs regularly in May over the entirety of the eastern US. April’s distribution of thrush observations tends to hold true to this pattern of occurrence primarily west of the Appalachians across years, with the smaller number of records of this species east of the Appalachians occurring only in the last days of April (see this map, and zoom to see individual observations). But, even considering that a broader pattern of many more earlier western observations and arrivals in this area is the norm, April 2022 was particularly powerful in illustrating this situation.
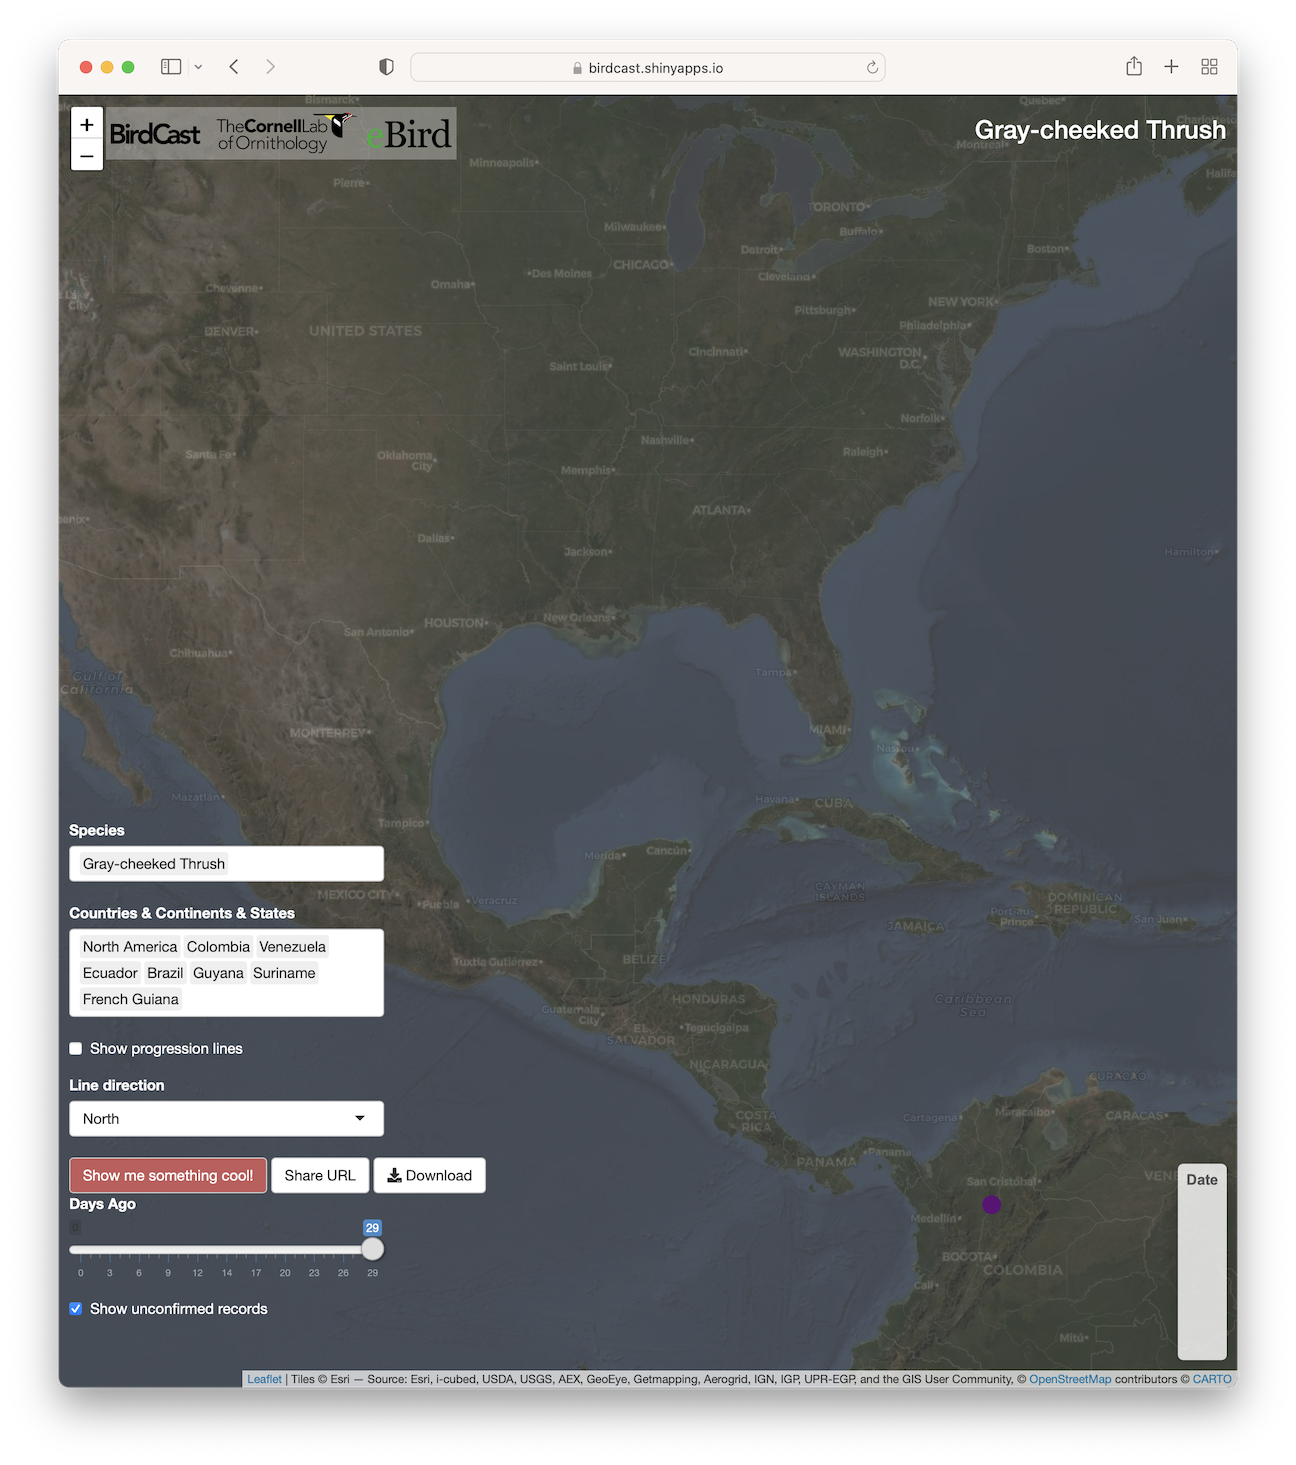
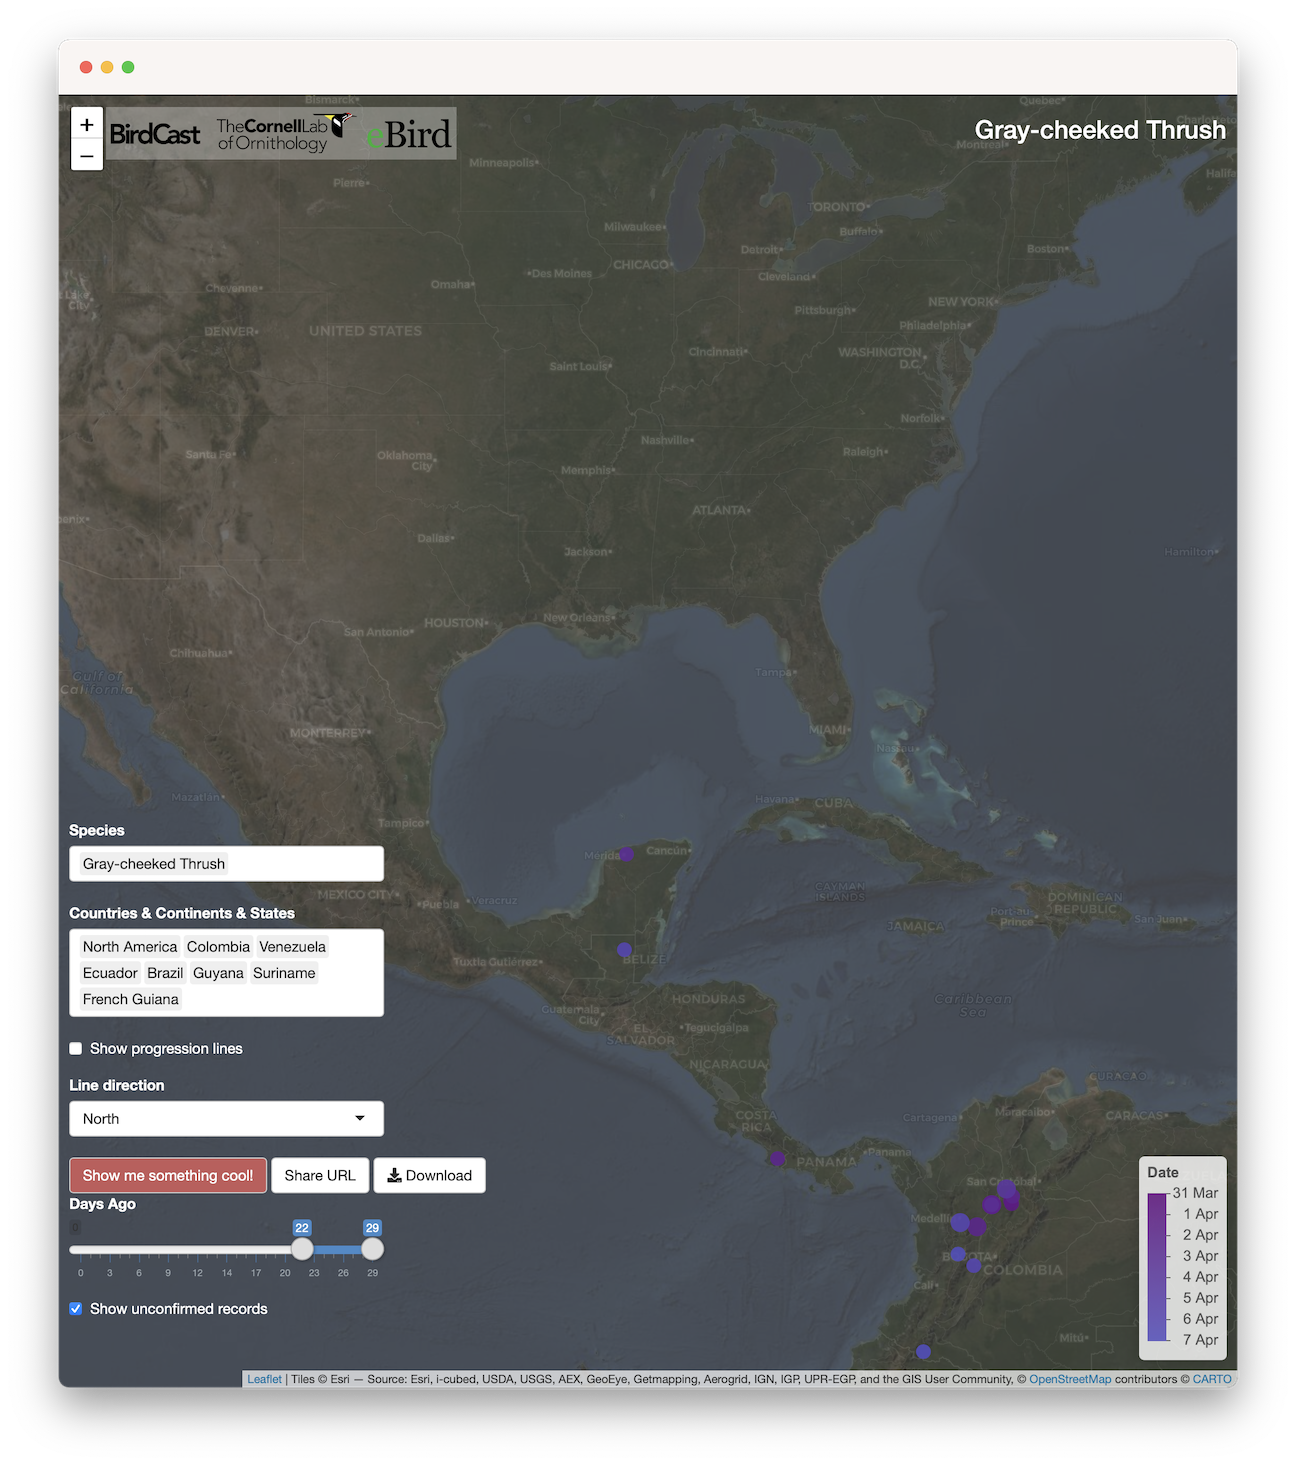
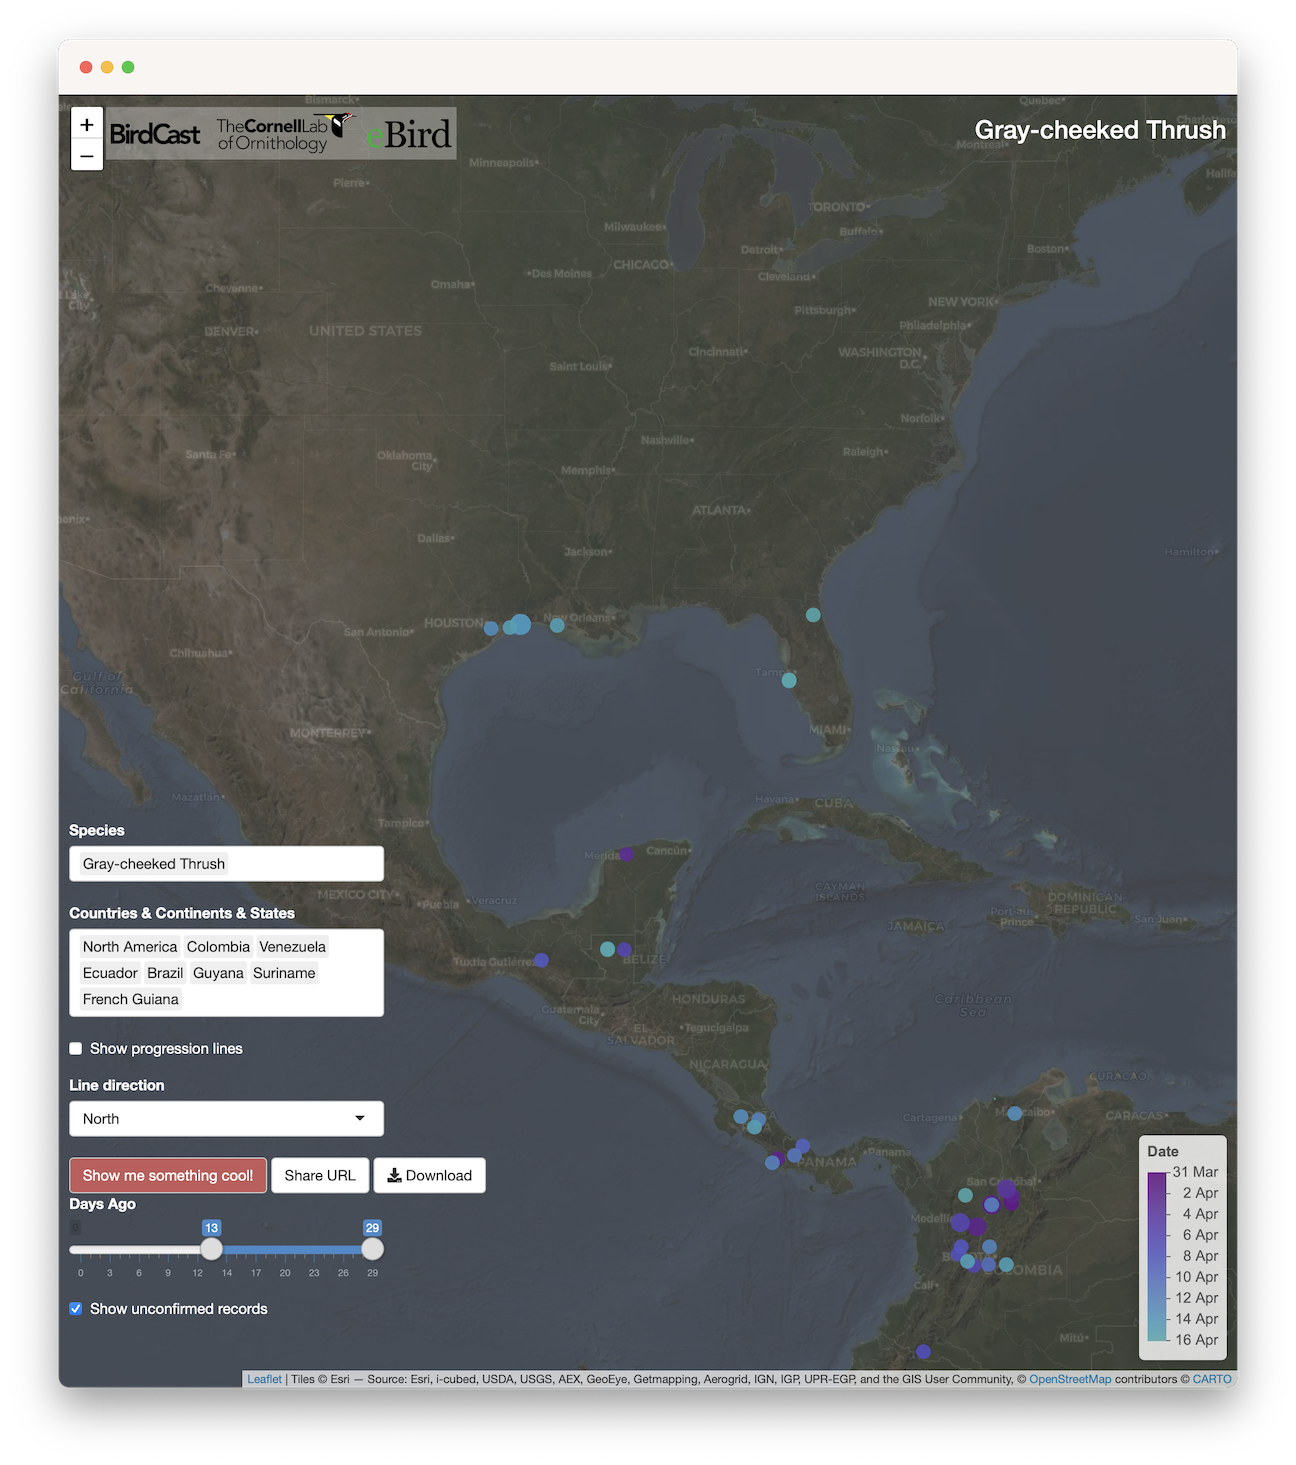
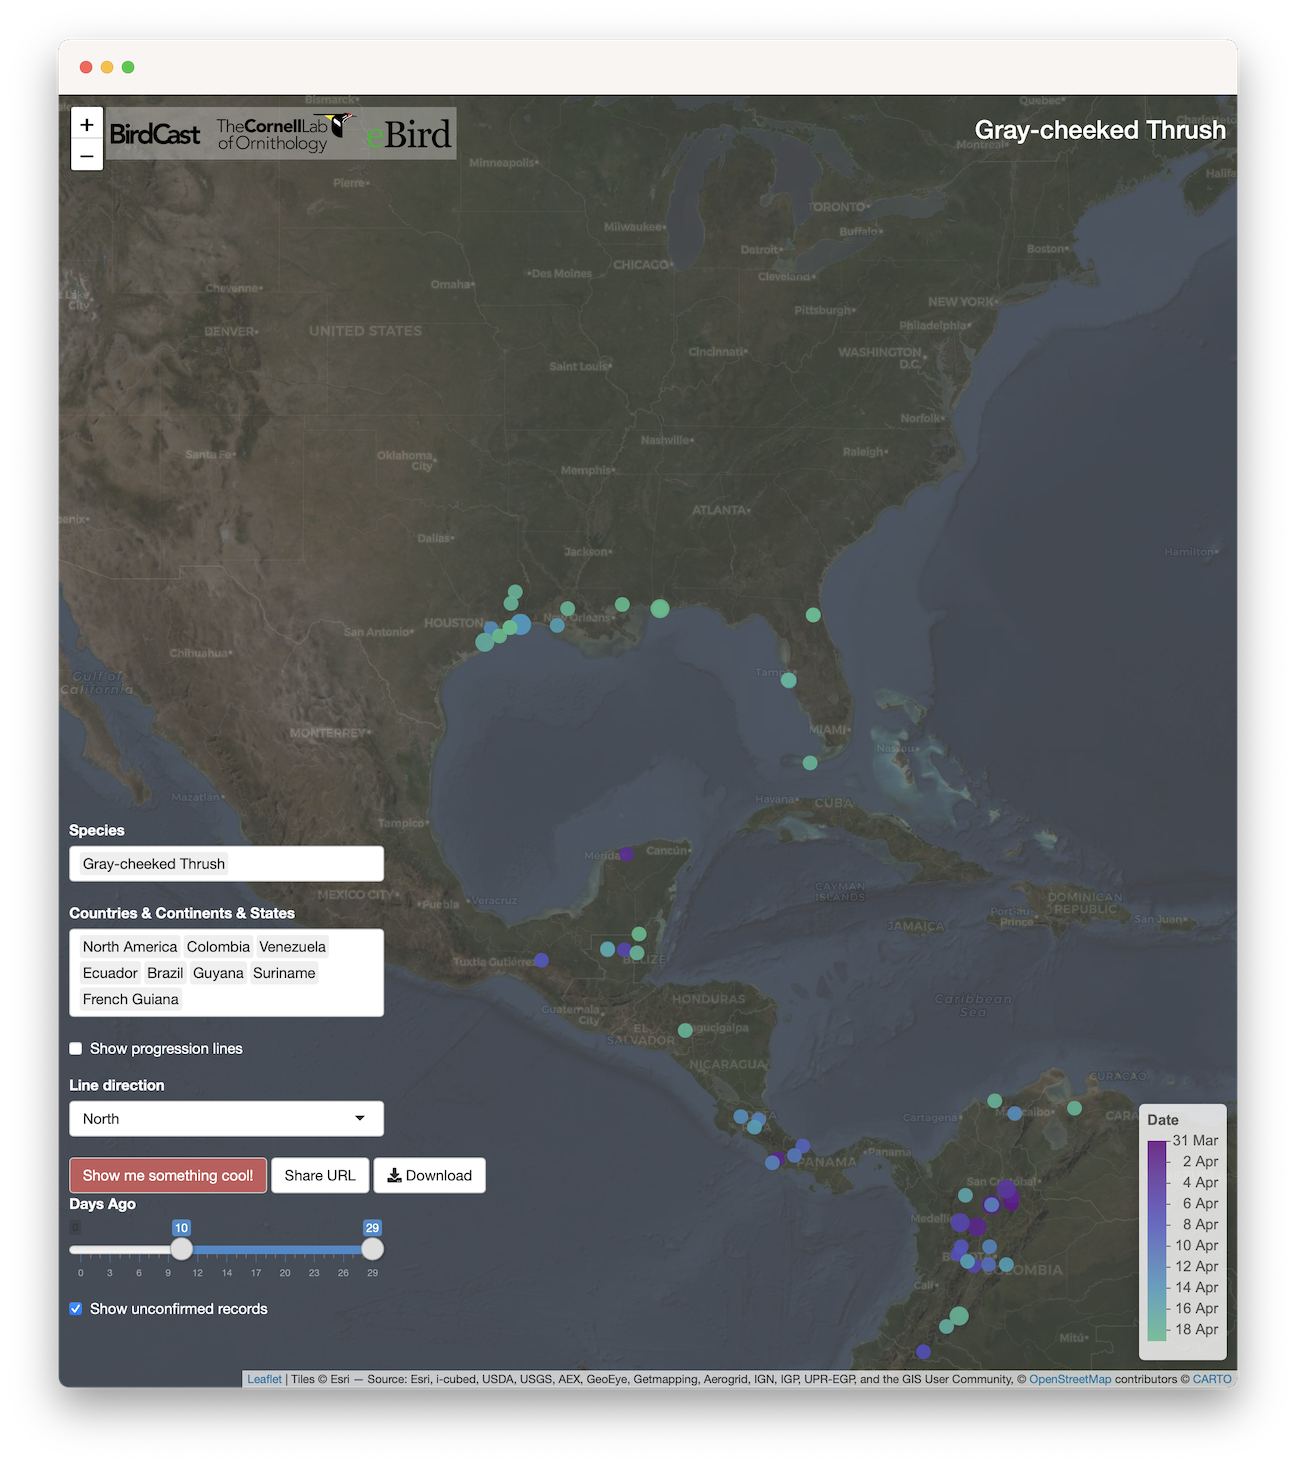
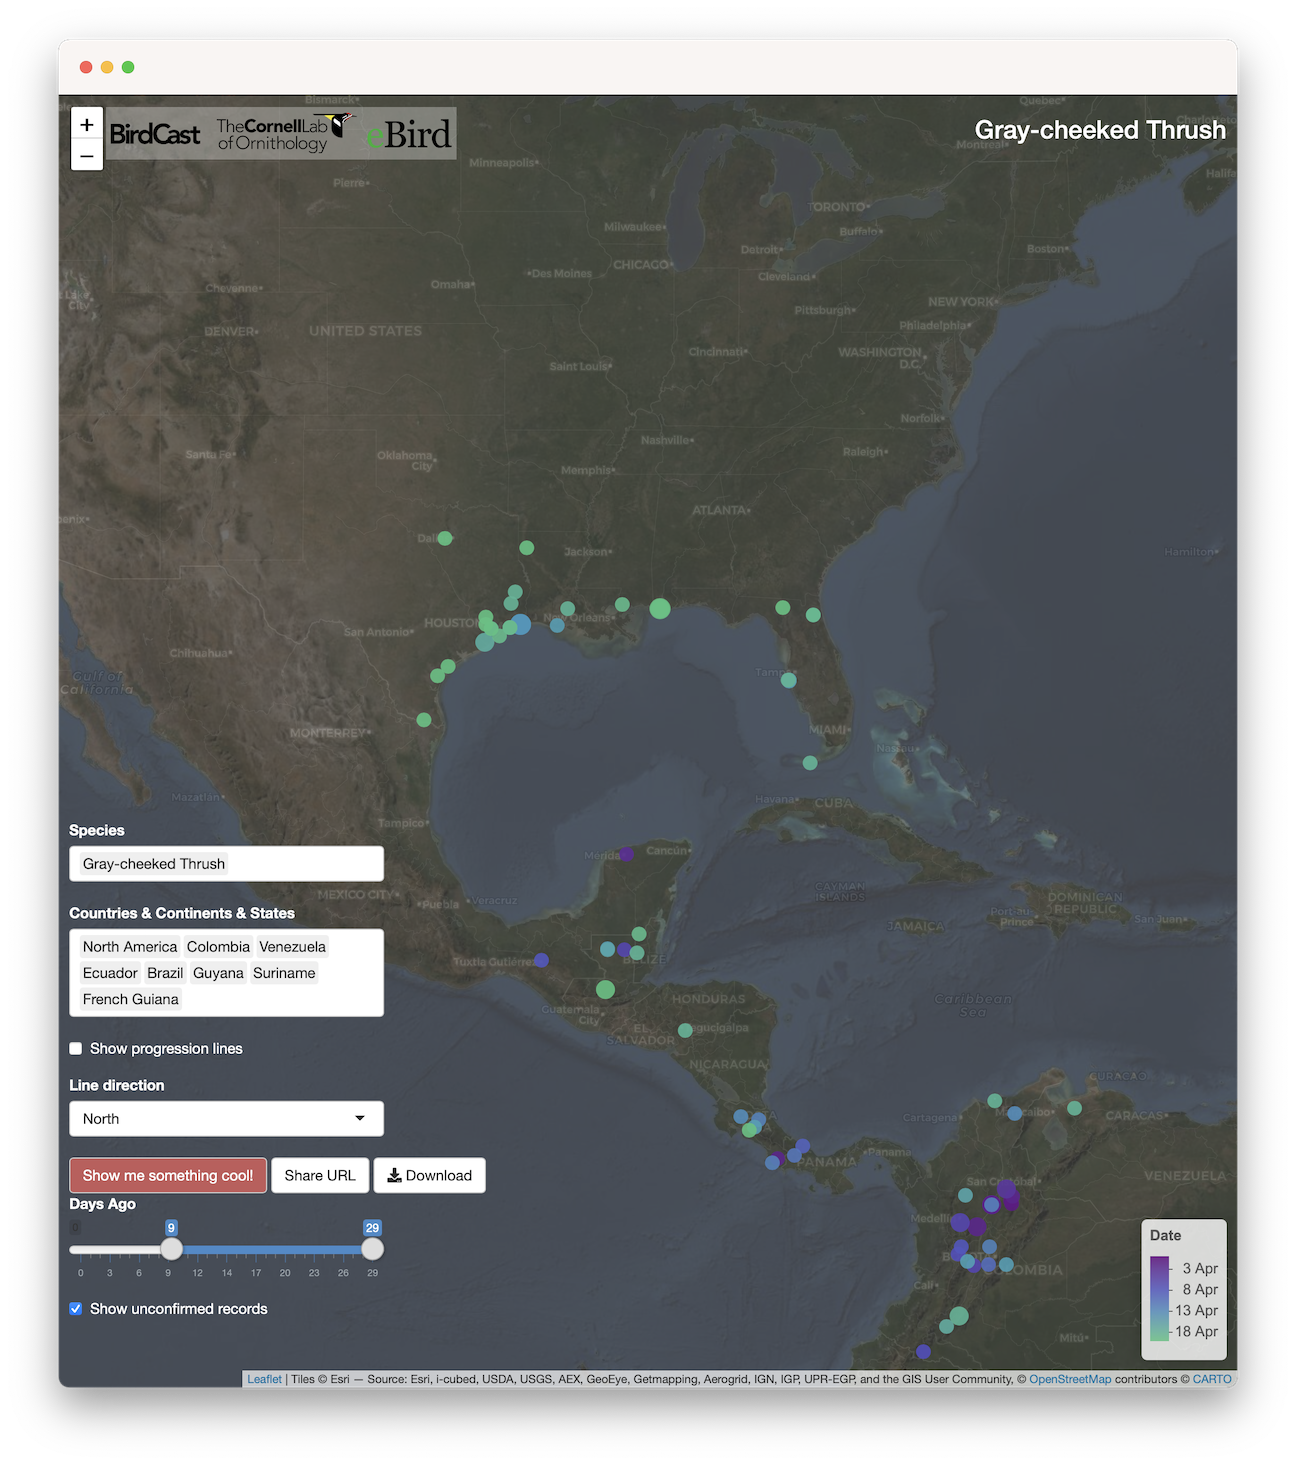
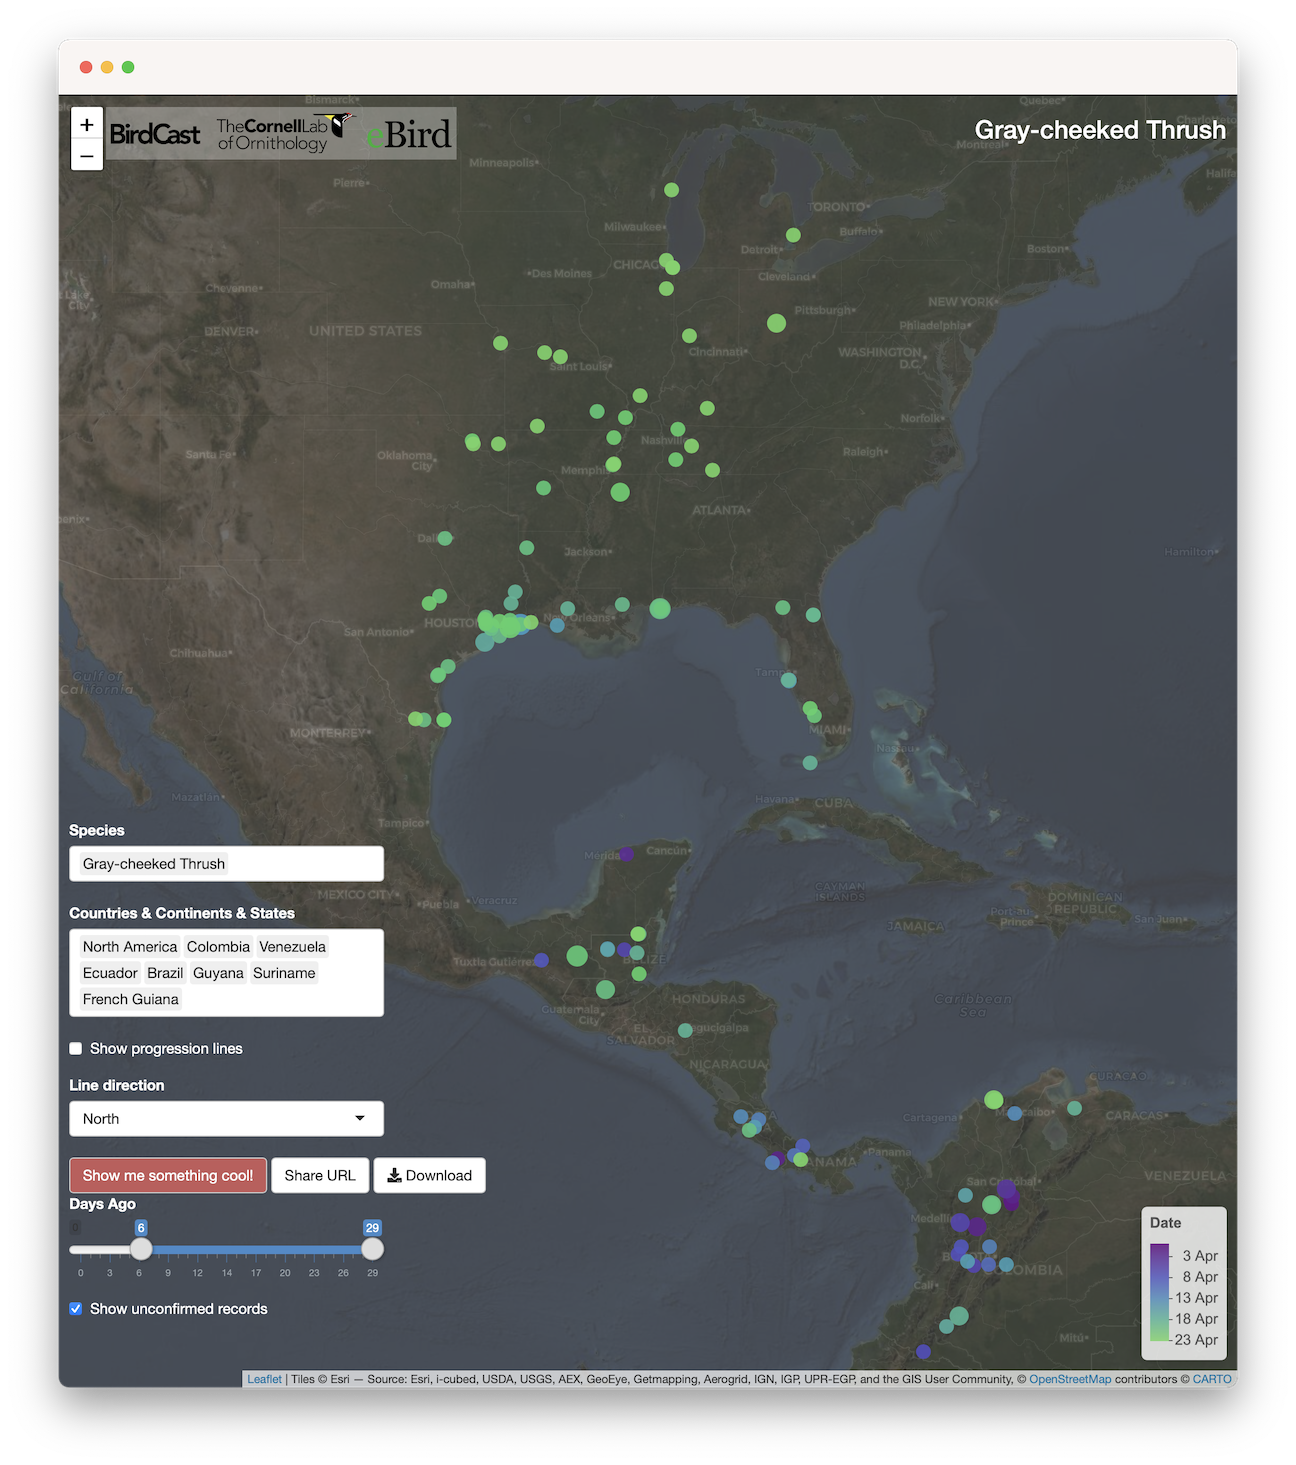
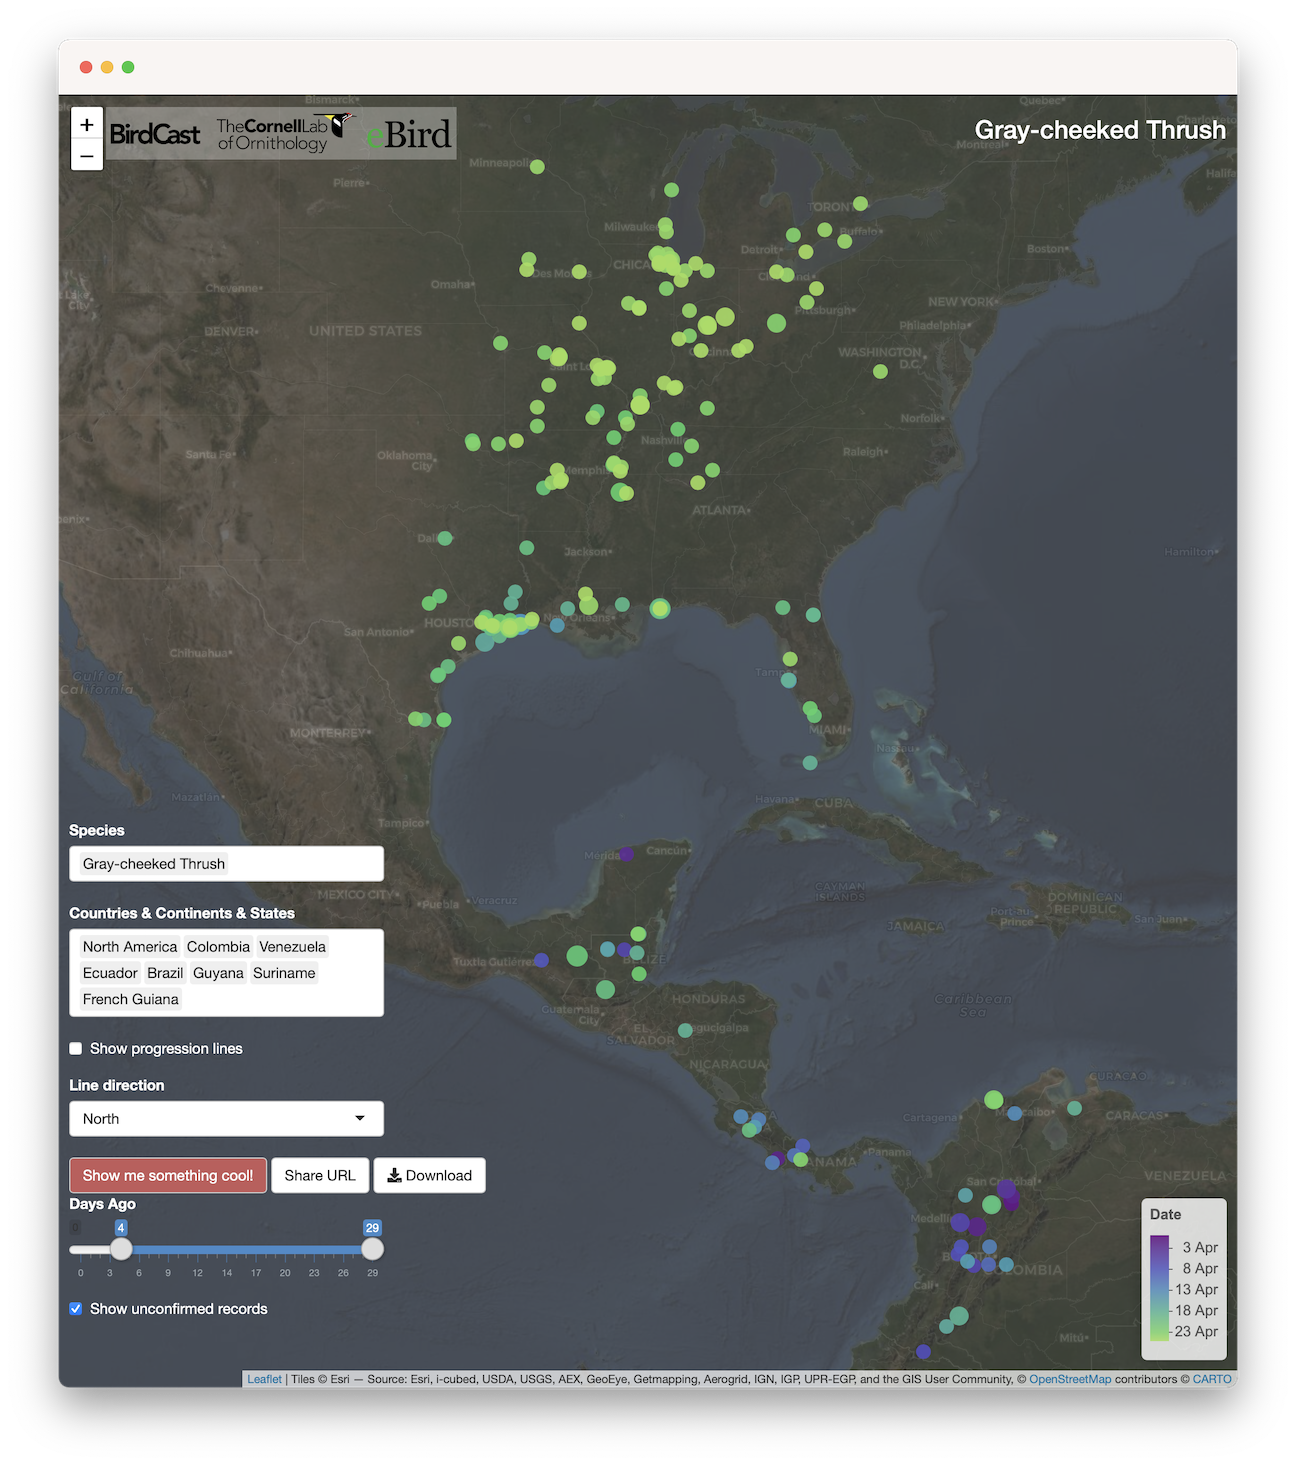
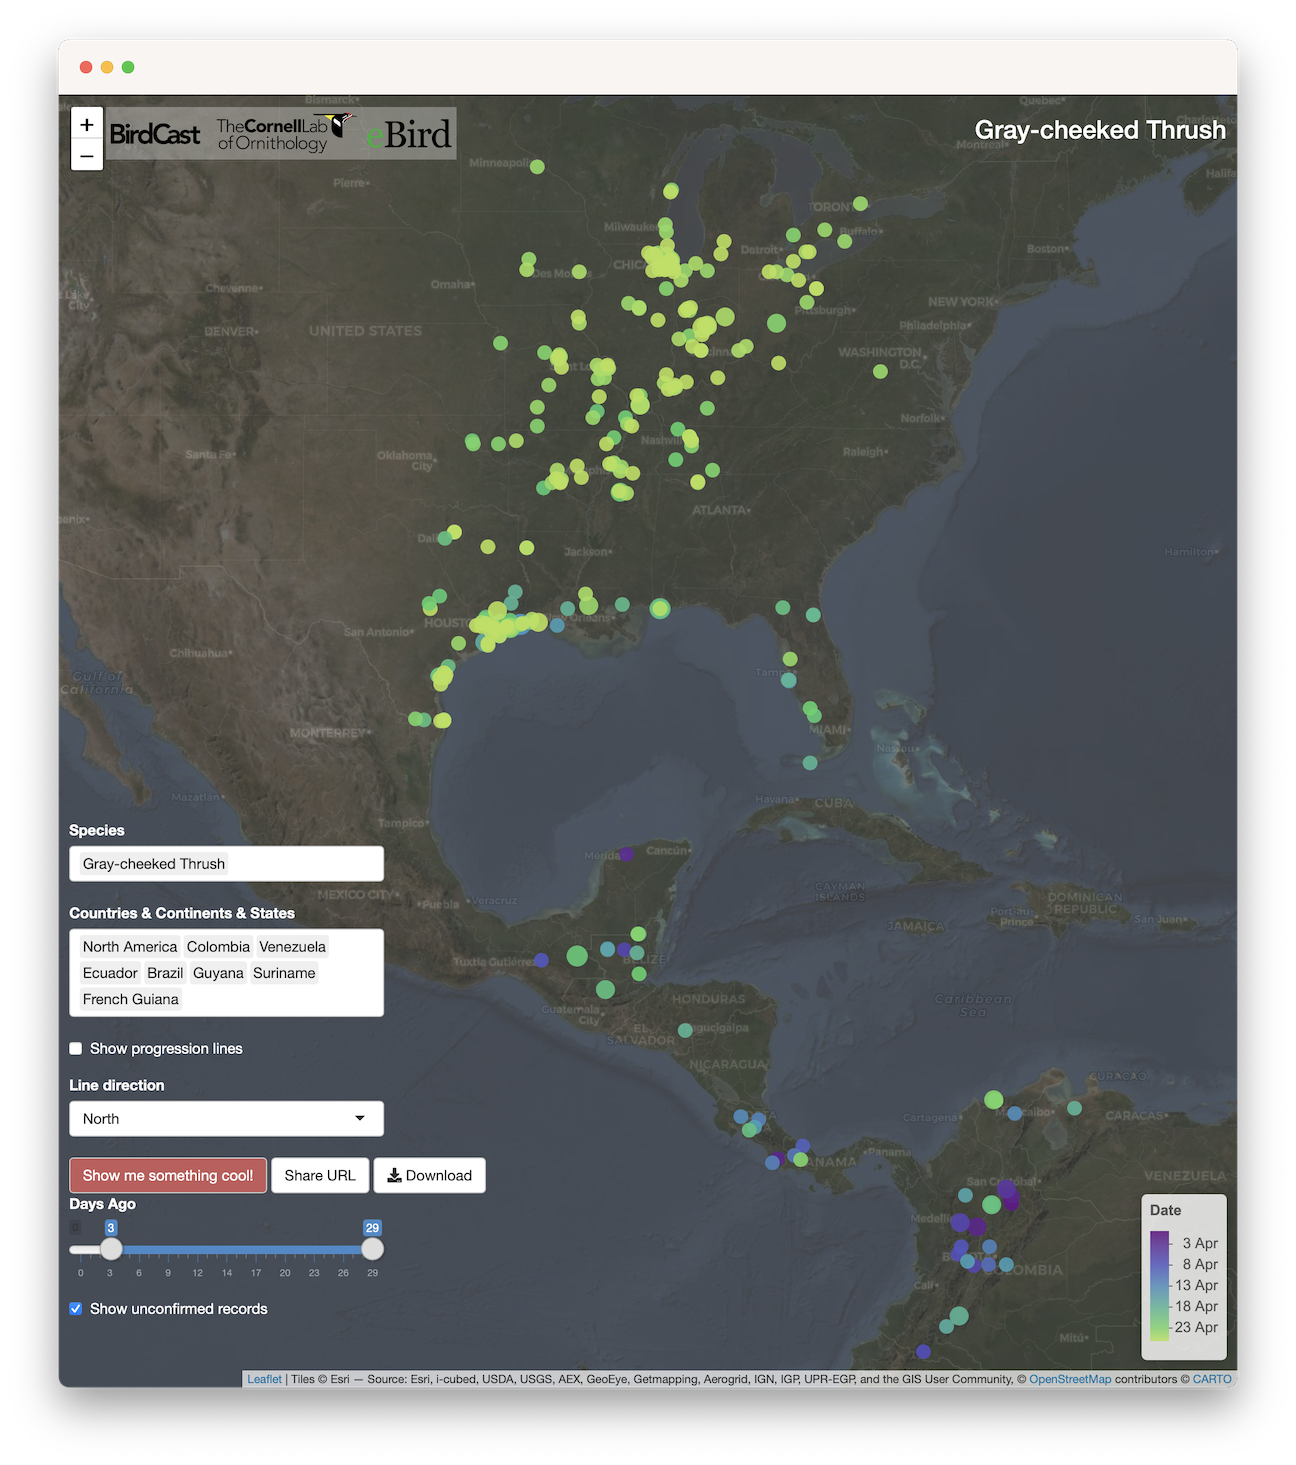
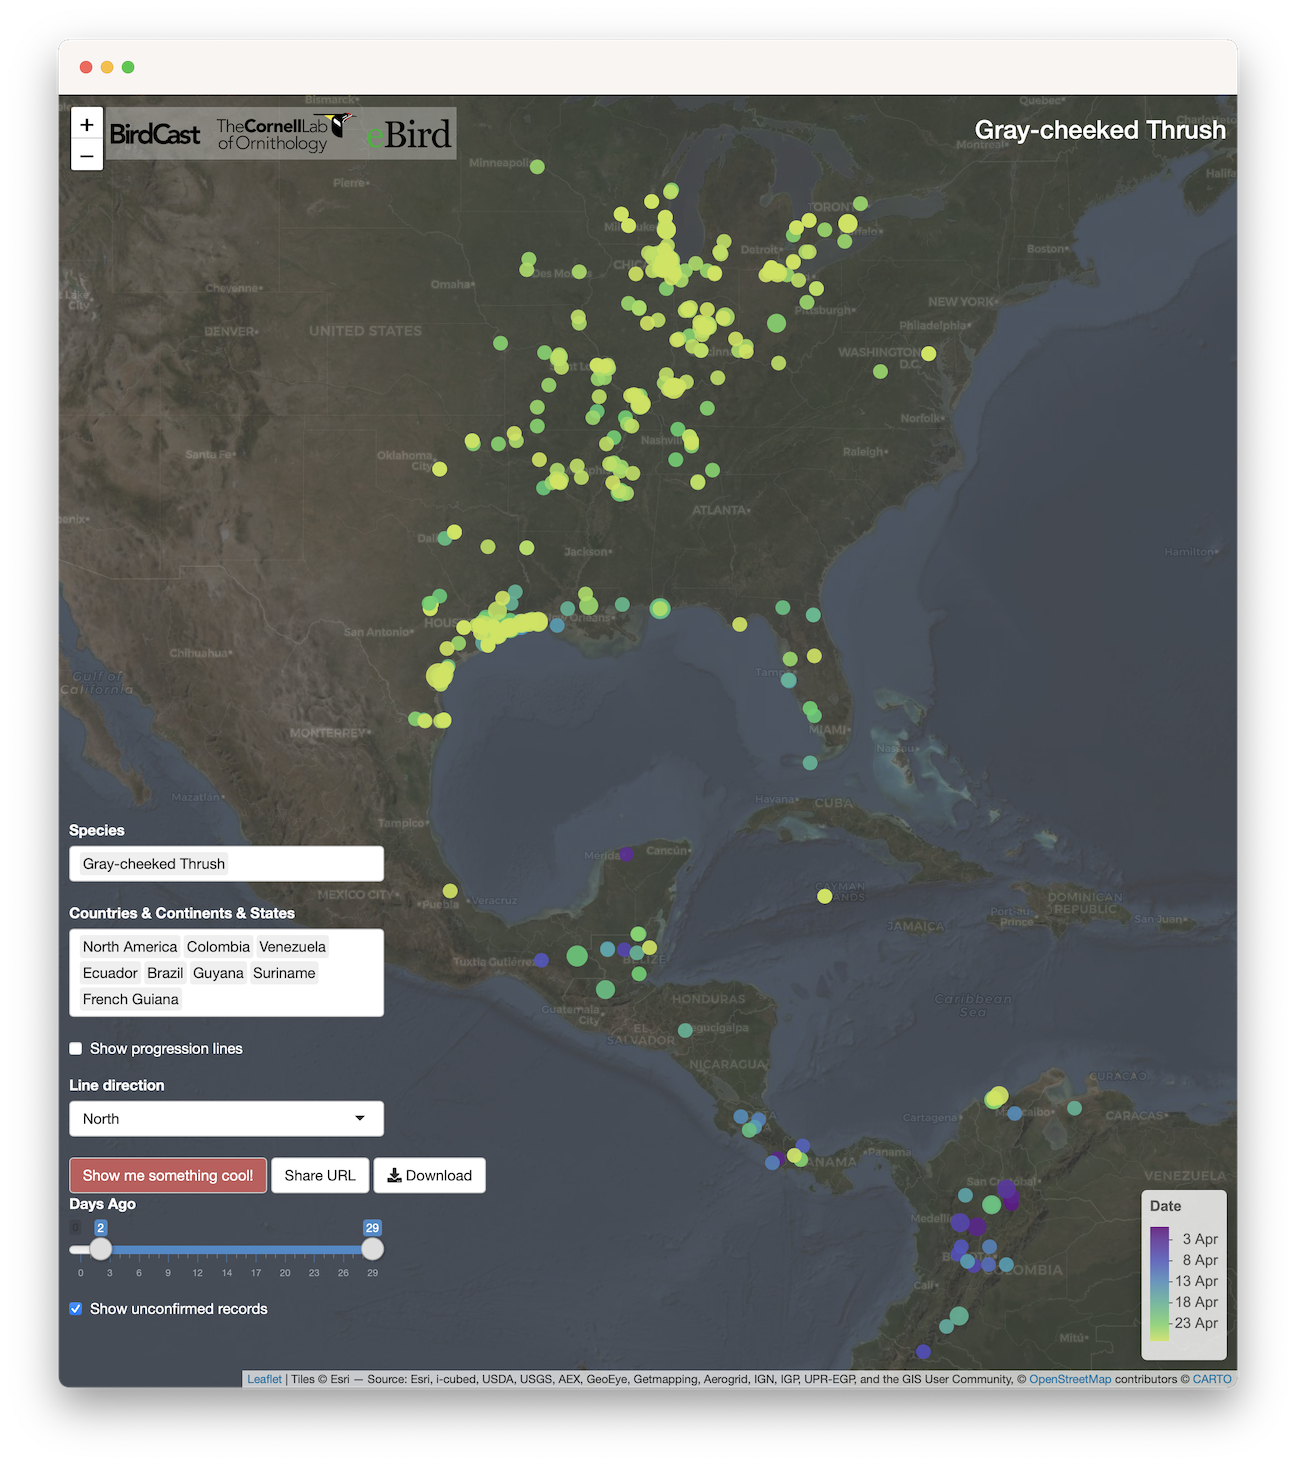
In reviewing this pattern of Gray-cheeked Thrush arrival in greater detail, we see that arrivals of this species do not begin in earnest until after 20 April, especially apart from earlier birds arriving in the far southern US. The animation below shows observations of this species from a 30-day window ending in late April. We see that prior to 20 April most thrush observations occurred in the Gulf of Mexico region, followed by a rather dramatic increase in observations much farther north after 20 April. This increase includes some records of individuals reported almost as far north as the Canadian border.


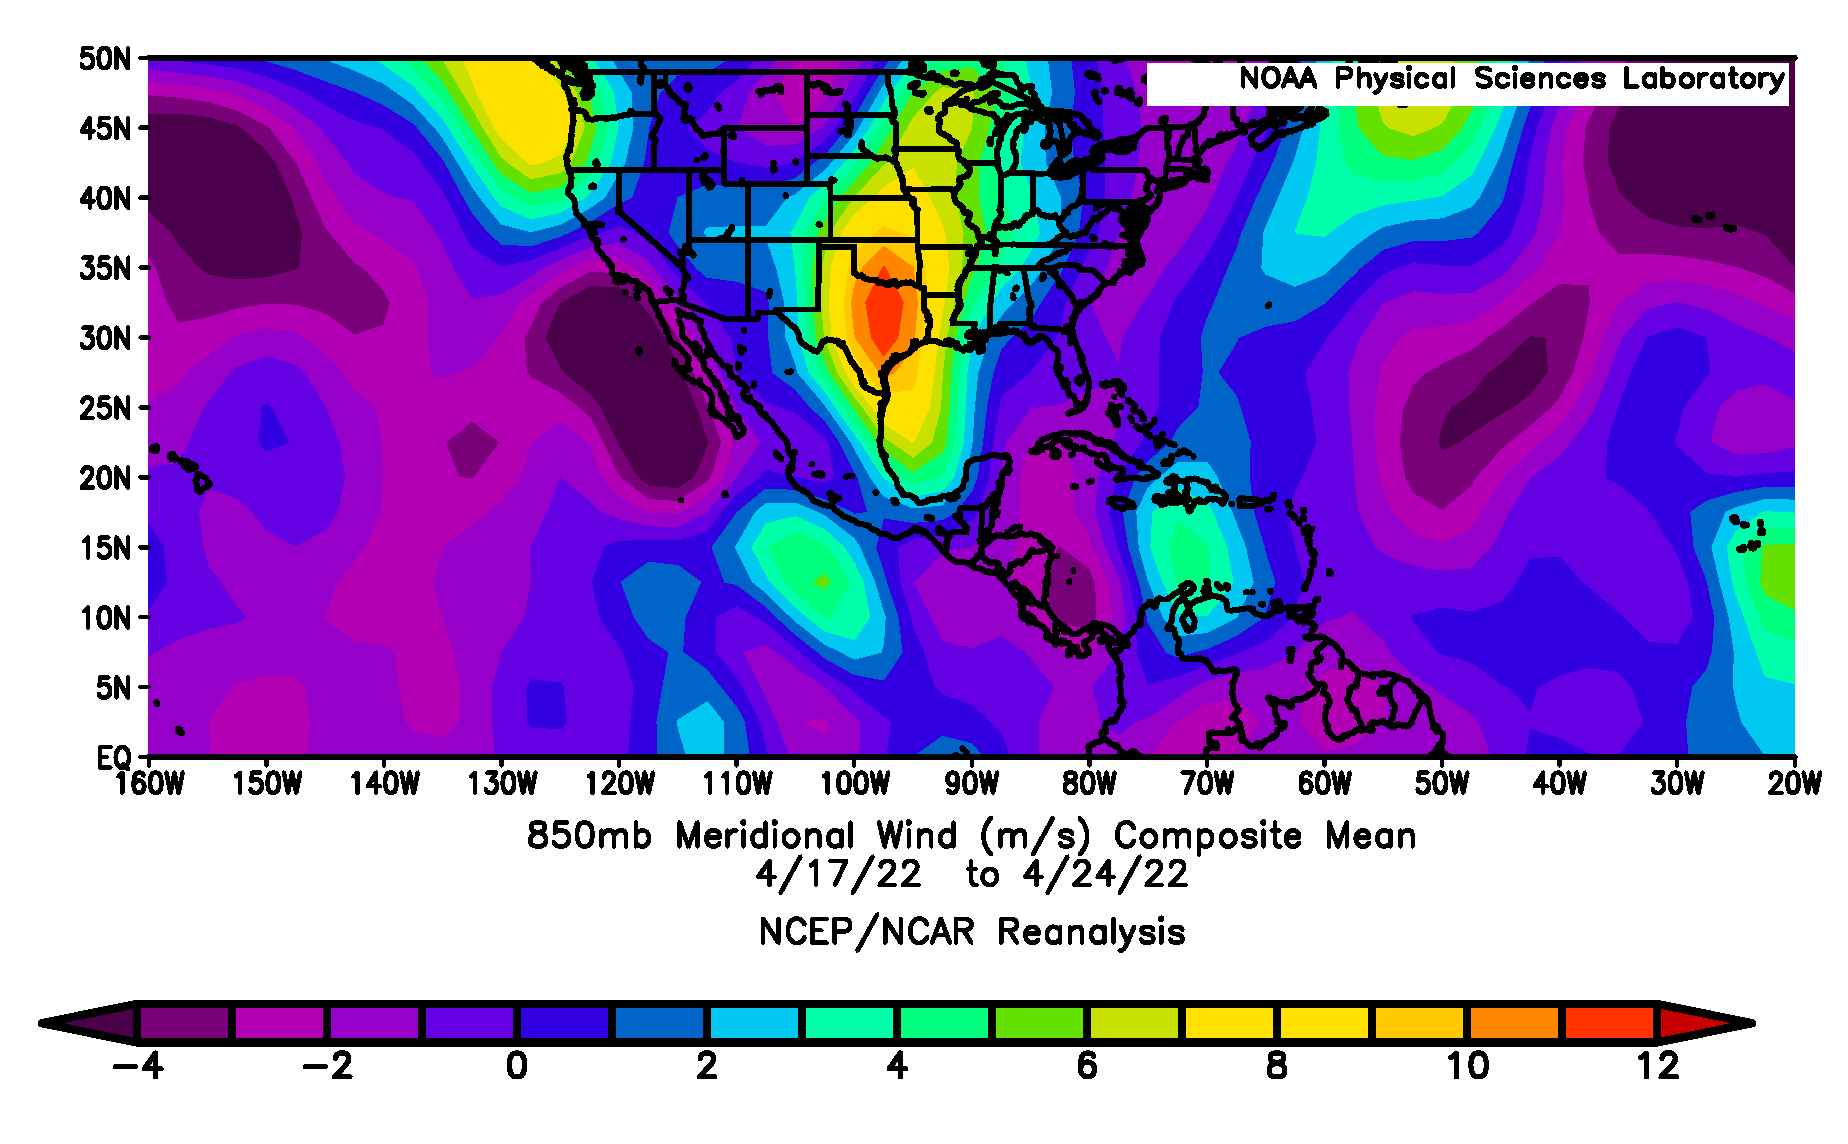
This distribution reminded us of the importance of favorable southerly winds that occur in this region every spring, winds that migrating birds use to their advantage in covering large distances in short periods of time. And in exploring patterns of winds aloft, particularly those at altitudes of 1,500 meters above the ground, we see some significant overlap in the occurrence of thrushes and the distribution of southerly winds (i.e. winds blowing from the south). The below image of meridional winds – those that flow in the north-south orientation – shows mean wind speeds for the 17-24 April 2022 period. Notice all those colors from blue to red, representing southerly winds above 0 meters per second. Look in particular at the oblong red shape over eastern and central Texas, representing the most intense winds from the south, and the adjacent oranges and yellows, all representing southerly winds averaging more than 7 meters per second – quick calculations convert this to approximately 15-27 miles per hour – offering a tremendously supportive tailwind for birds traveling generally with the wind toward the north. Look further to see that these supportive southerly flow spans an enormous swath of airspace from the Isthmus of Tehuantepec north to Canada.
The image below conveys an even more dramatic representation of this same period of time for comparing the pattern of supportive southerly wind and Gray-cheeked Thrush observations. When considering this year’s patterns of winds aloft given average patterns of the last 30 years, we see a major anomaly spanning a broad latitudinal range from Texas to the western Great Lakes (red in the image below, indicating anomalously strong southerly flow 6 meters per second above average, or approximately 13 miles per hour above average). This unusually strong thoroughfare of tailwinds would allow migrating birds an enormous boost to travel farther faster than possible under their own powered flight, saving precious energy and time en route to breeding areas.
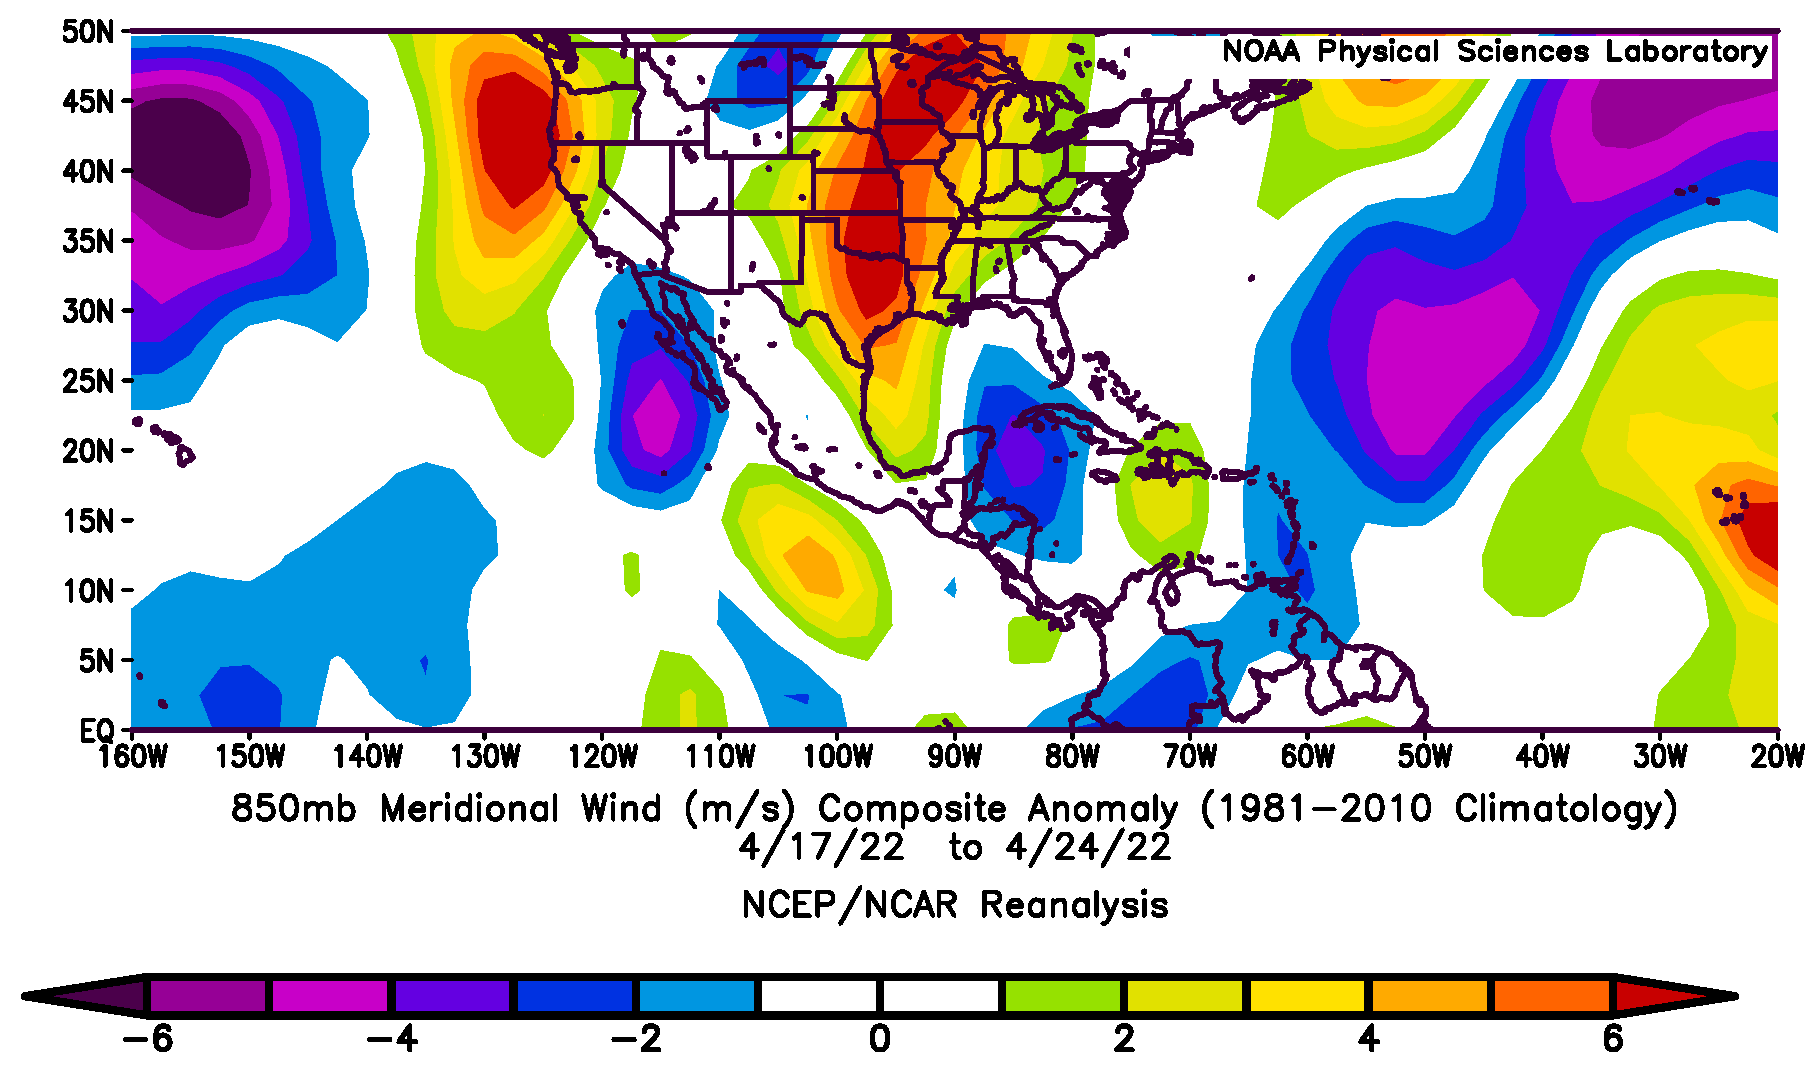
Perhaps equally striking in both visualizations of winds aloft distributions – though more so in the first, composite mean image – is the patterns of unfavorable, northerly winds – those blowing from the north – in areas east and south of the Appalachians. The top image depicts these as purple colors, distributed from the Yucatan Peninsula north to the Canadian Maritimes. The bottom image highlights that the strength of these northerly winds is not anomalous, occurring in the 0 meters per second above average colors of white.
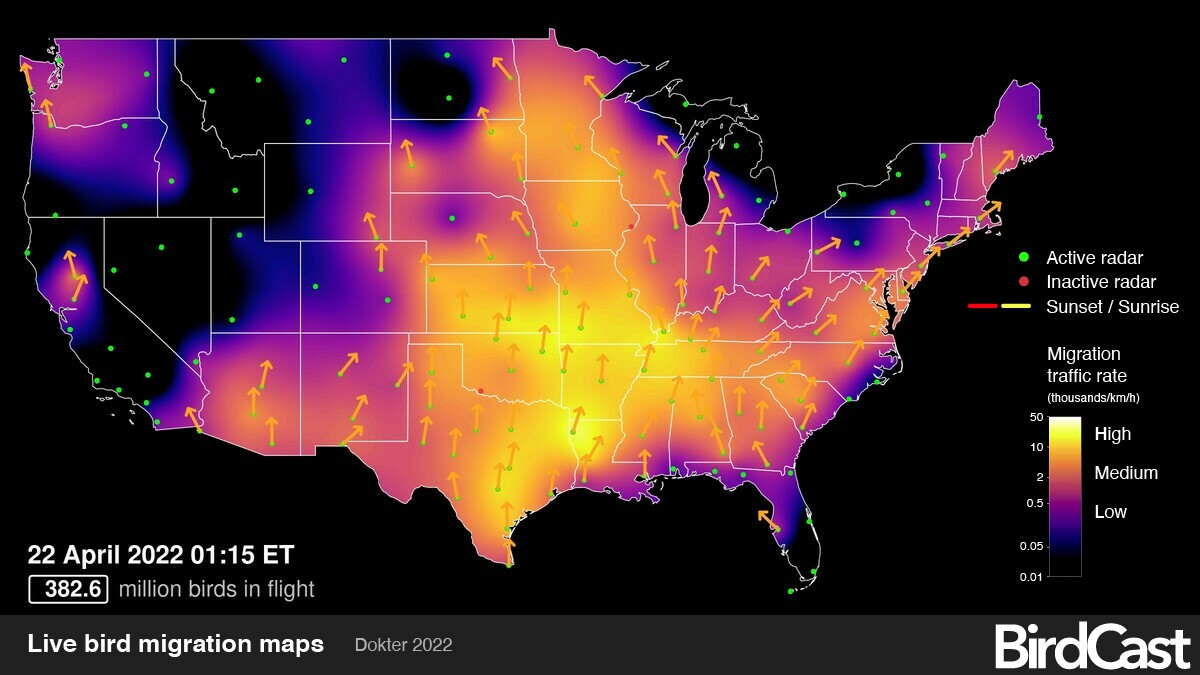
The April 2022 distribution of Gray-cheeked Thrush observations in eBird presumably belies a typical spring pattern of earlier movements that advance much farther north in more western areas of this species’ migration paths (e.g. the Mississippi River Valley, Upper Midwest to the west of the Appalachians) in contrast to the later pattern of transit from more eastern locations along the Atlantic Seaboard (in May, for example, from the individual tracking of Gray-cheeked Thrushes 7796, 7782, and 18299). That different populations of the same species migrate using different routes is not necessarily a novel insight, in the sense that numerous studies at individuals’ and species’ scales have either shown or suggested this (check out this MOTUS Gray-cheeked Thrush infographic); rather, the community science observations from April represent a timely realization at a scale between these two, offering perhaps some rich and exciting research paths to investigate the migration strategies of earlier arriving Gray-cheeked Thrushes and their use of April’s much stronger southerly winds – and in this year anomalously so. Furthermore, broader patterns of later April movements relative to winds may highlight even more cases where birds use favorable winds in this region, described previously by e.g. Wainwright et al. (2016), to their advantage (e.g. and more generally in strong wind regimes known as low level jets); a quick look at the new BirdCast Migration Dashboard shows a pulse of migration for 22 April in Missouri, Indiana, Iowa and Illinois, evidence of a broader pattern from the live migration map for the US on 21-22 and 22-23 April 2022.
For many species including Gray-cheeked Thrush, a species with some very clear examples of its stopover and migration strategies (e.g. Gomez at al. 2017), there is more we can learn about migration, including its evolution, its maintenance, and its future under climate change, by integrating the data now available from individual tracking, community science, meteorological, climatological, and radar data.