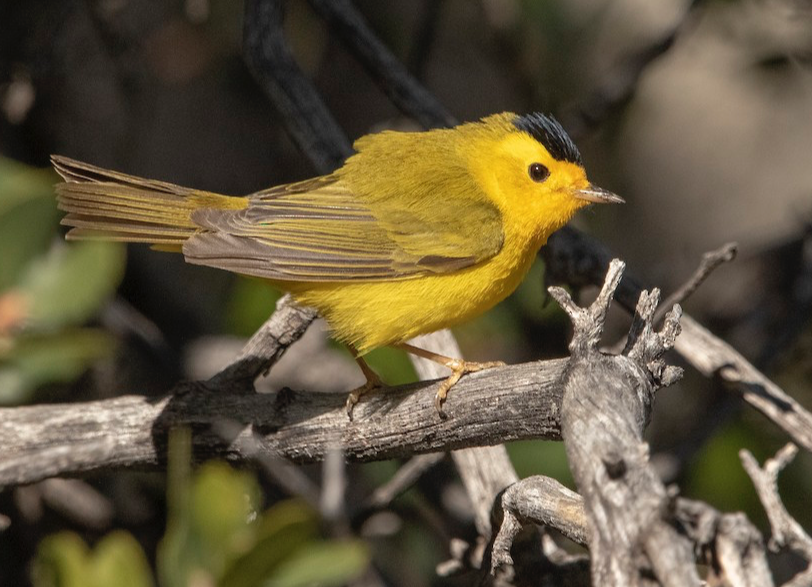
Wilson’s Warbler. Alexander Harper/Macaulay Library. eBird S67364488. This species has been on the move recently, and its passage will become increasingly apparent across the region in the coming two weeks.
This update focuses on the migration activity in the West that we have seen on the US weather surveillance radar network over the past week. Several nights of significant movements were apparent over radar stations close to the Pacific Coast, and more generally west of the Great Basin. 16, 17, and 18 as well as 20 April 2020 (below) were particularly worth highlighting.
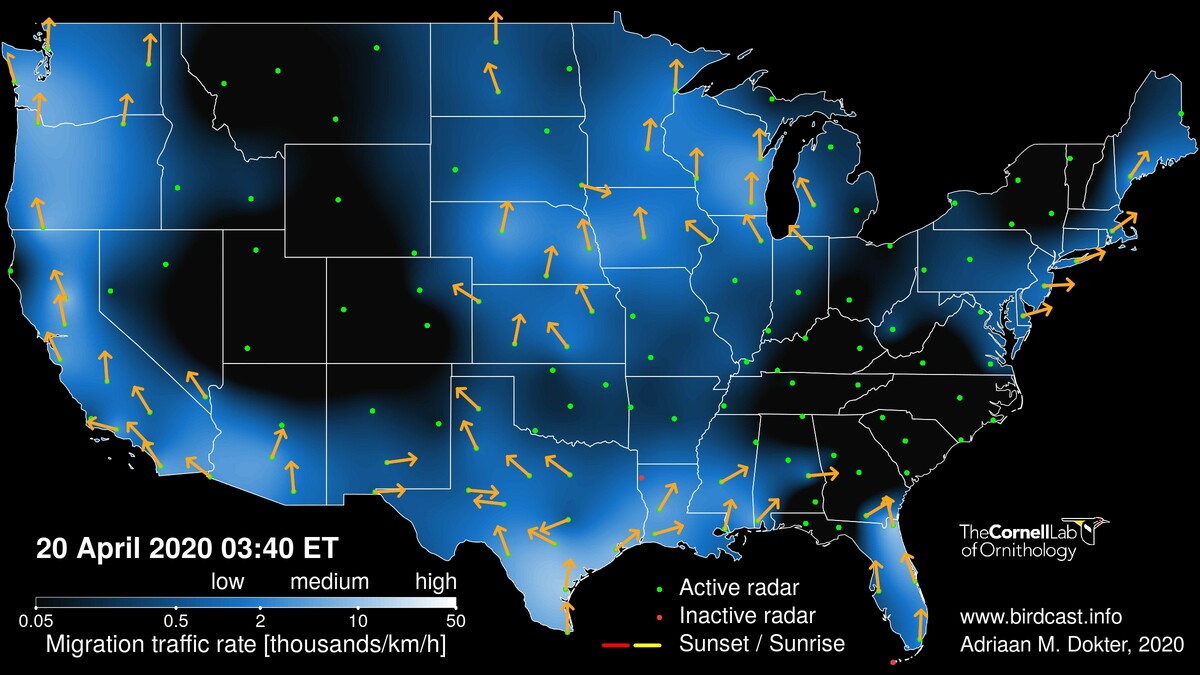
Of note are the primary directions of movement from the Arizona-California border north and west through Washington state. General direction of flight is slightly to the west of north through California into Oregon, diversifying in Washington to include more northerly and slightly east of northerly movement. This snapshot highlights what is a more complex pattern of movements of birds through and over valleys and mountain ranges that characterize western corridors from south to north, as well as a diversity of origins, destinations, and strategies of the species involved in these movements. Furthermore, the image also highlights a typical pattern we see in the region – clearly birds are migrating in the mountainous regions, where radar sampling is challenging and numbers of birds may be significantly lower than surrounding lower elevations.
Recent examination of such complexities of this region show how varied tactics that birds employ to navigate and orient can be. In general, there is much to learn about these complexities, and this is just the first of what the BirdCast team hopes will be a long list of studies of nocturnal migration in the West!
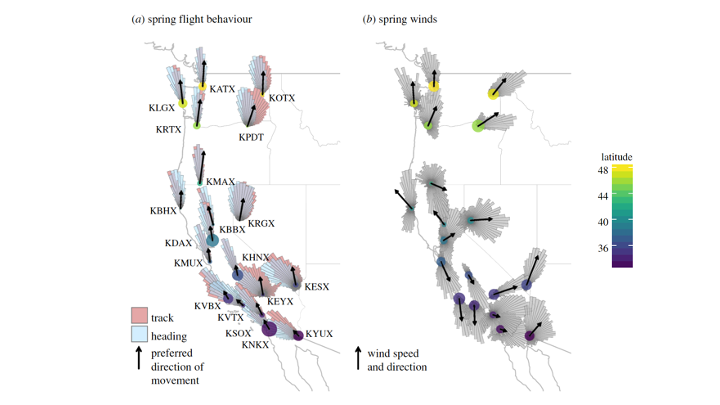
Adapted from Newcombe et al. 2019, Figure 1. Spring (1 March to 15 June, a,b) distributions of migrant track (pink), heading (blue) and wind direction (grey) at weather surveillance radar (WSR) stations summarized from 1995 to 2018 between sunset and sunrise. Note the patterns of movement and how they differ from south to north, similar to patterns we see in the above radar snapshot from a single night of the spring so far. Moreover, note these direction of flight in (a) relative to variation in wind directions in (b). Points show WSR station location and are shaded by station latitude. Station points (a,c) are scaled to the cube root of the average summed seasonal migration intensity and station points (b,d ) are scaled by the rho of wind direction (small points = low directionality). Flight distributions are weighted by the cube root of flight activity and wind direction by the product of the cube root of flight activity and wind speed. Arrows’ directions denote primary direction of movement (PDM) (a,c) and average wind direction (b,d ). PDM arrows’ lengths (a,c) are scaled to average migrant groundspeed and wind arrows’ lengths (b,d ) are scaled to the average wind speed. Note, all distributions are scaled to the same size and number of observations, but exhibit differing maxima. Rose diagrams are summarized in 5° sectors.