At BirdCast, we’ve been working towards real-time analyses of bird migration. We’re excited to bring to the web site next-day analyses of bird migration in the northeast United States, made possible by the National Weather Service’s network of Doppler weather radars and some recently published research by the BirdCast team.
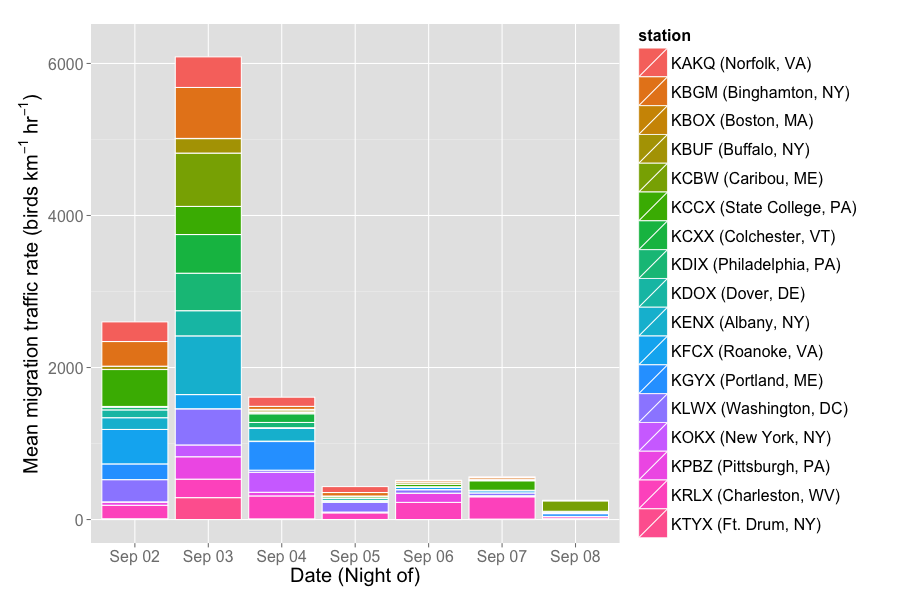
We’ve been tracking migration in the region closely over the past week. The following graph shows our estimated numbers of birds passing over 17 regional radars. The last substantial movement was nearly a week ago, with little to no movement since then as high pressure, hot weather, and southerly flow have dominated.
The vertical axis of the above plot represents the estimated numbers of birds passing over a one-kilometer line each hour above each radar station. For example, the mean passage rate at KBGM (Binghamton, NY) last Thursday night (September 3rd) was about 700 birds per km every hour.
We expect that to change in the next few days, starting tonight (mostly inland), and especially tomorrow, as a major front brings northerly winds and drops high temperatures by 20 degrees or more.

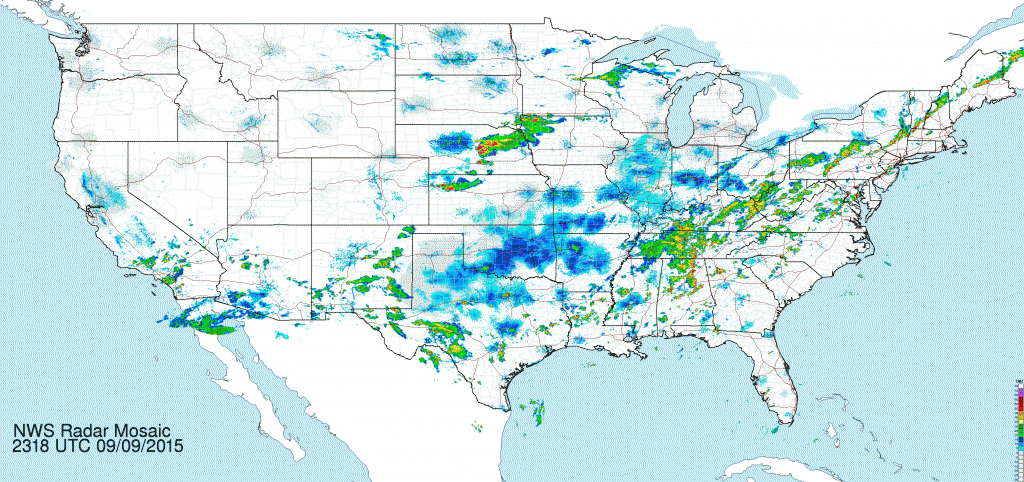
The mosaic above shows a line (well, more like a “line”) of precipitation (the blocky and irregularly shapes of green, yellow, red) from Tennessee north and east into New England; the precipitation and the storms producing it are associated with a boundary between air masses (i.e. a frontal boundary). Behind this front (i.e. to its west and north), favorable conditions for migration will build rapidly and will spawn heavy and locally very heavy migration.
If you go out birding over these next few days, please consider entering your sightings in eBird. This will help provide a more comprehensive idea of how these nocturnal migration events translate into on-the-ground birding.
Stay tuned in the coming days for more analyses and brand new graphs and maps as we watch the fall migration floodgates open in the northeast.
————————————–
Farnsworth and Van Doren


