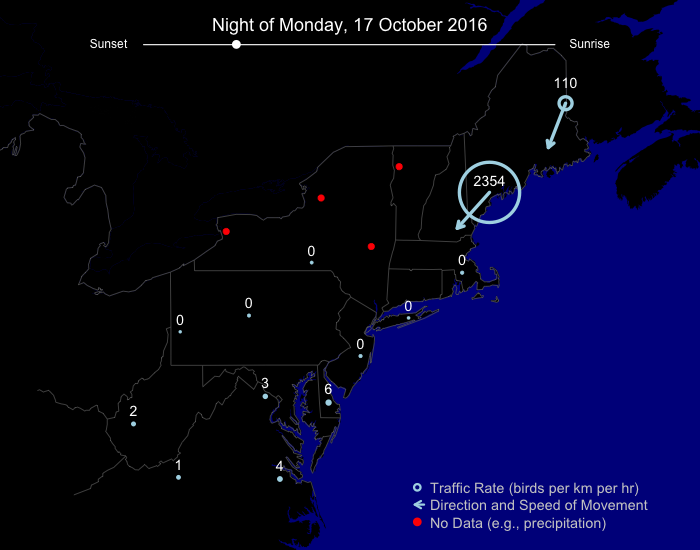
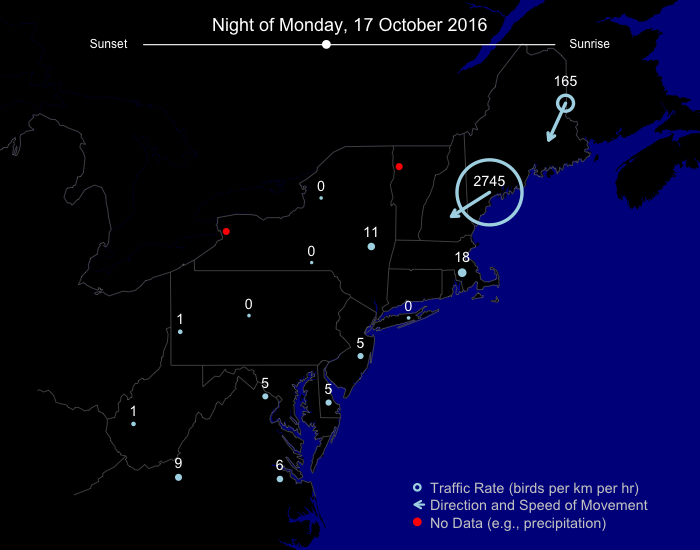
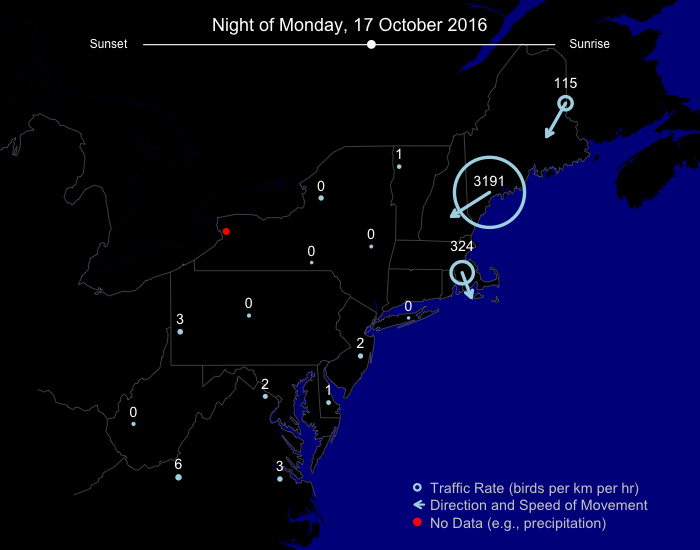
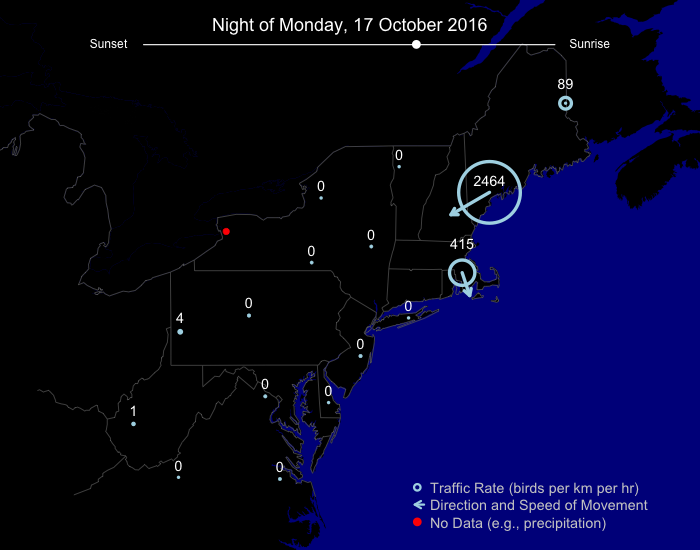
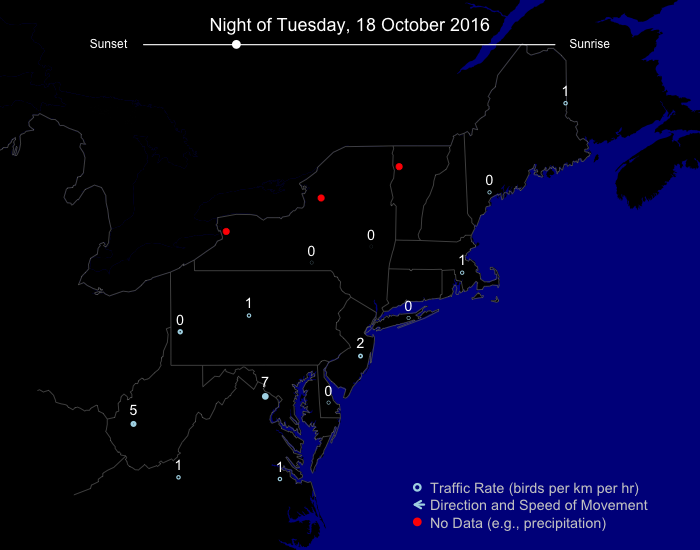
Welcome to this installment of BirdCast Traffic Reports, posts describing northeastern US nocturnal bird migration traffic rates, as calculated from a completely automated pipeline of algorithms. The images you see in Traffic Reports present the migration traffic rate (MTR), direction of bird movement, and speed of bird movement.
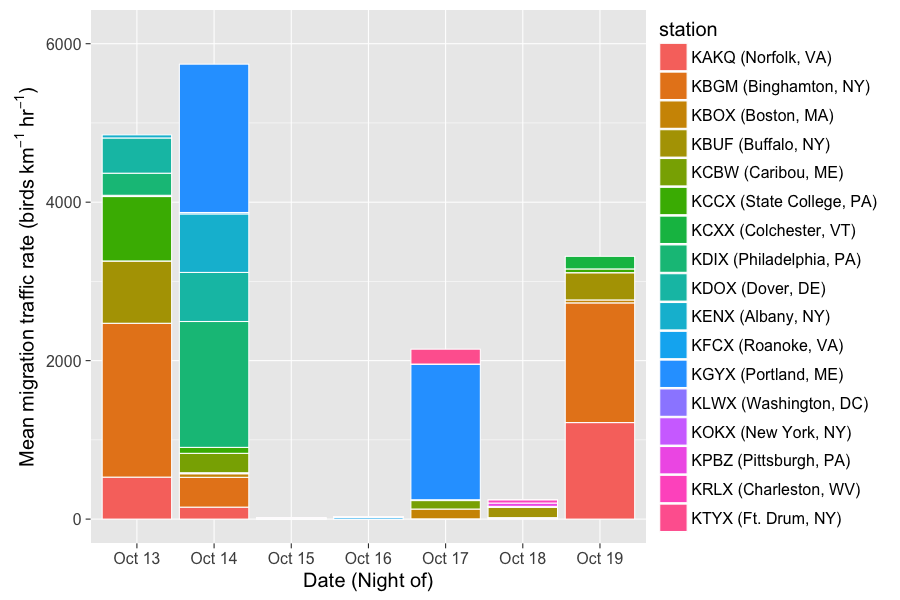
This week so far has featured some significant movements on 13, 14, and 19 October. Particularly active have been the Binghamton, NY, and Roanoke and Norfolk, VA radars. The loop that follows below shows a more detailed characterization of these movements.

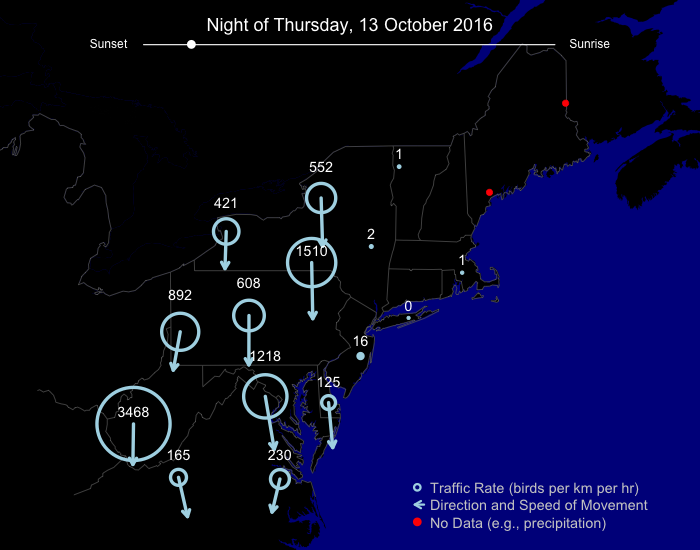
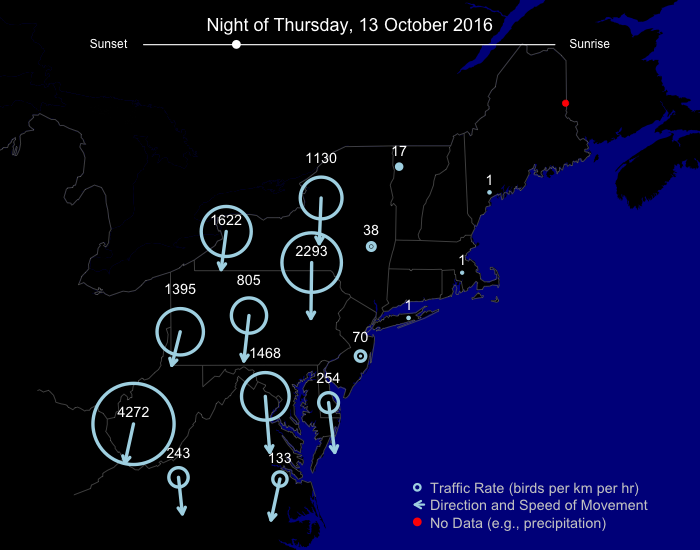
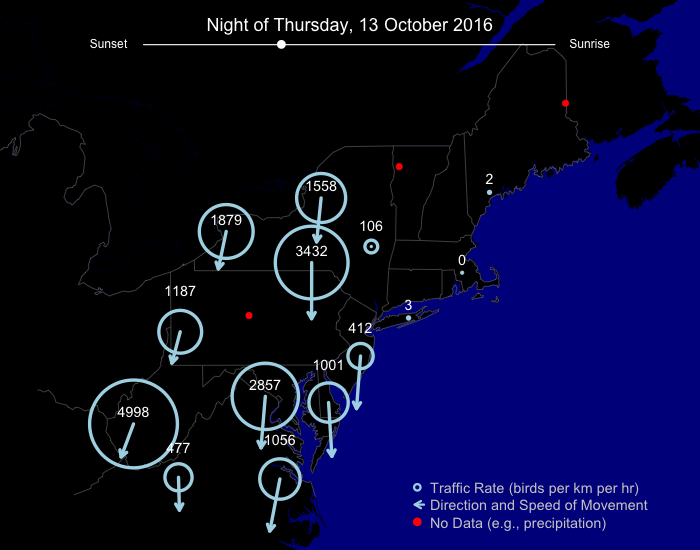
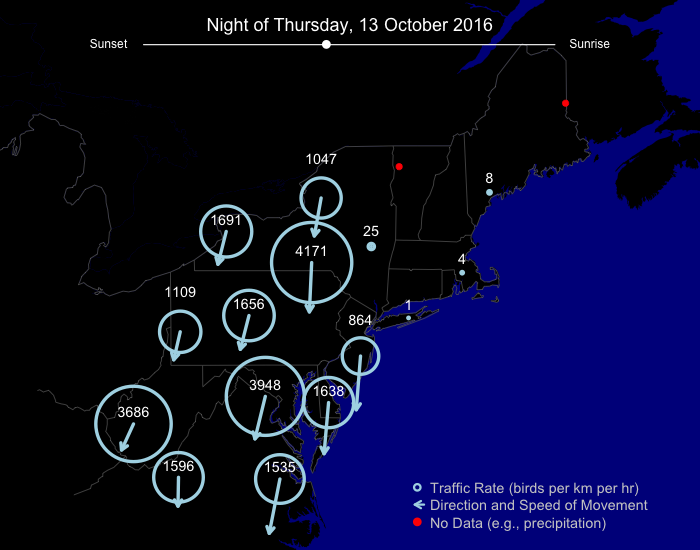
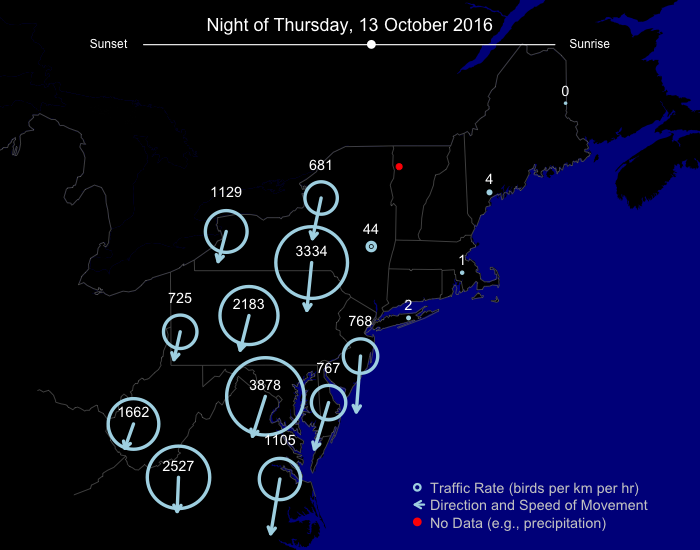
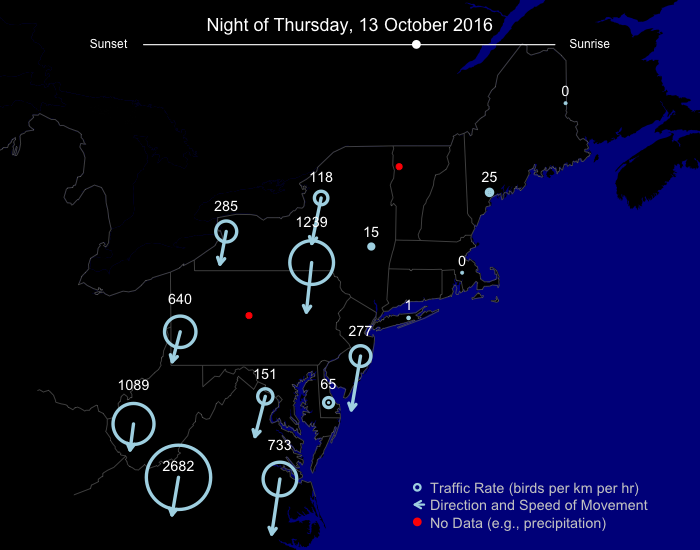
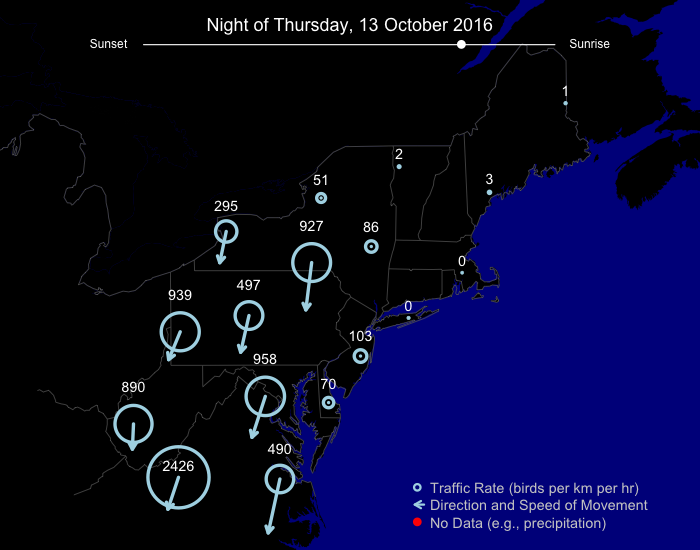
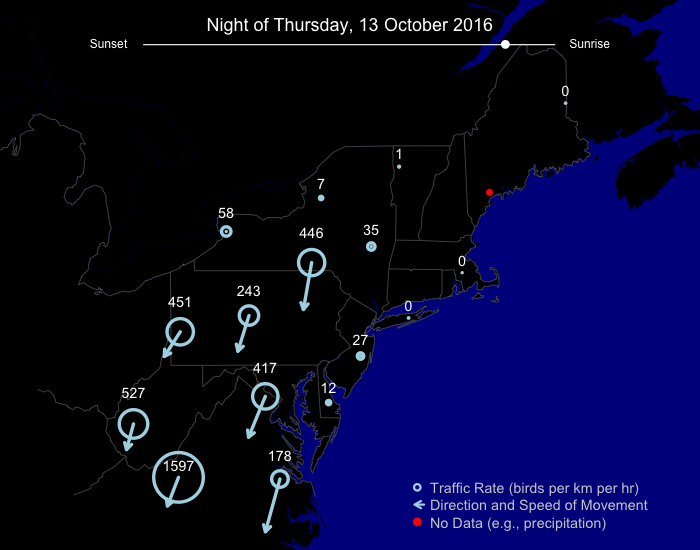
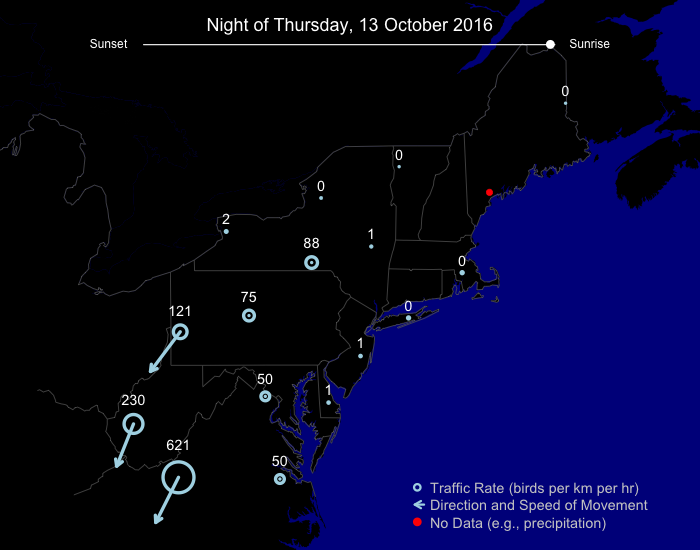
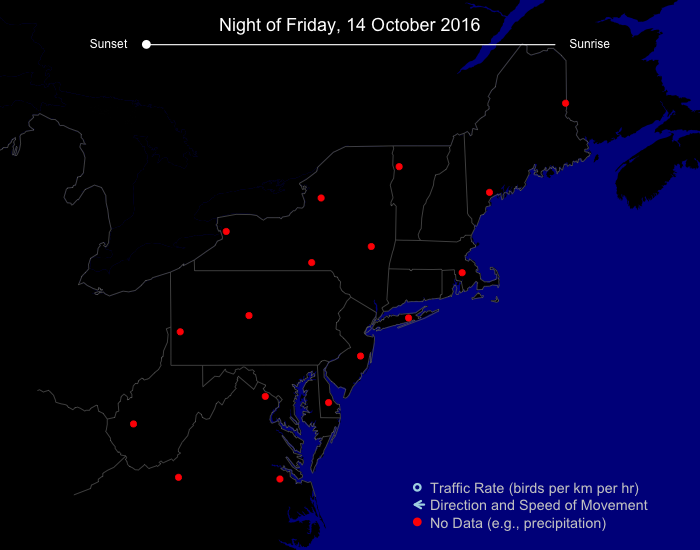
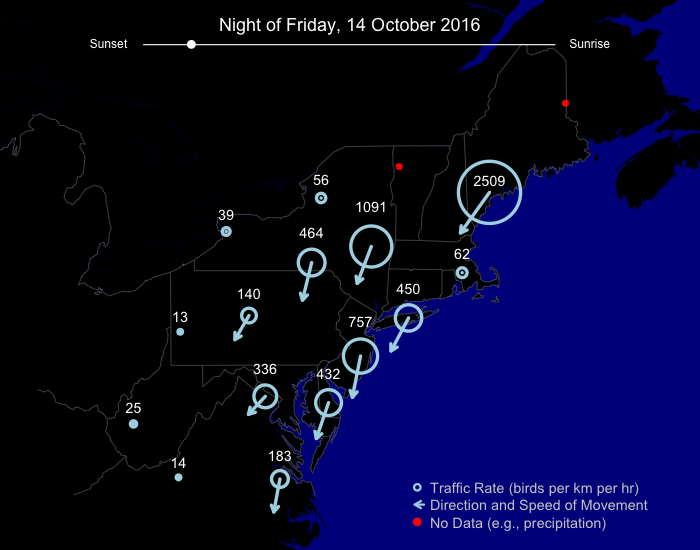
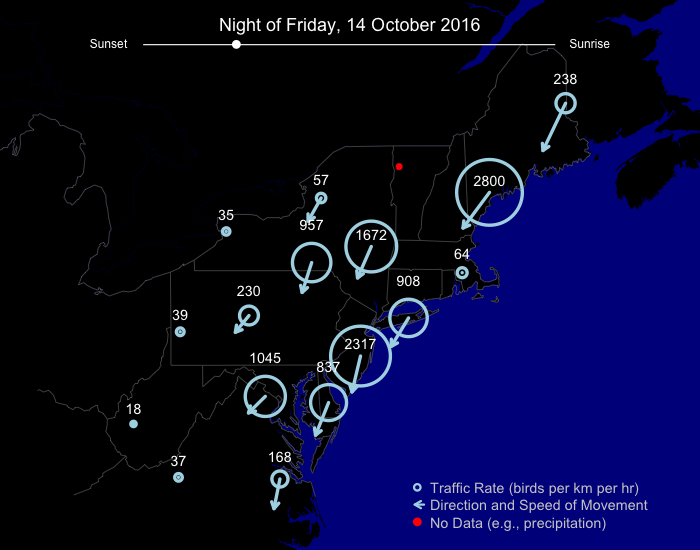
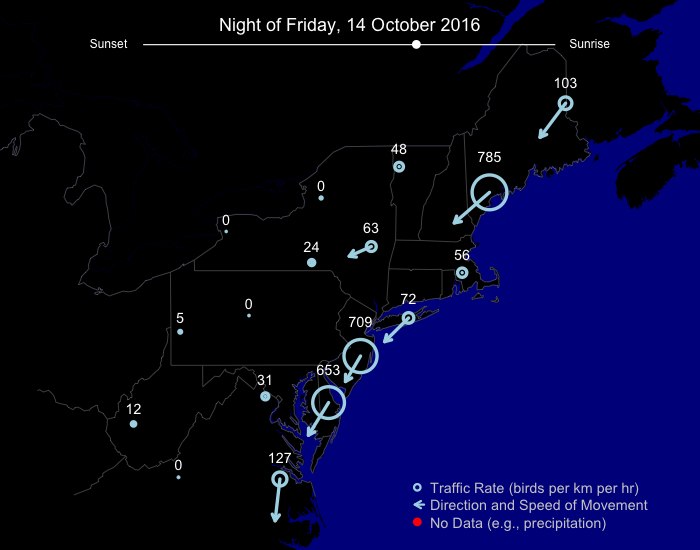
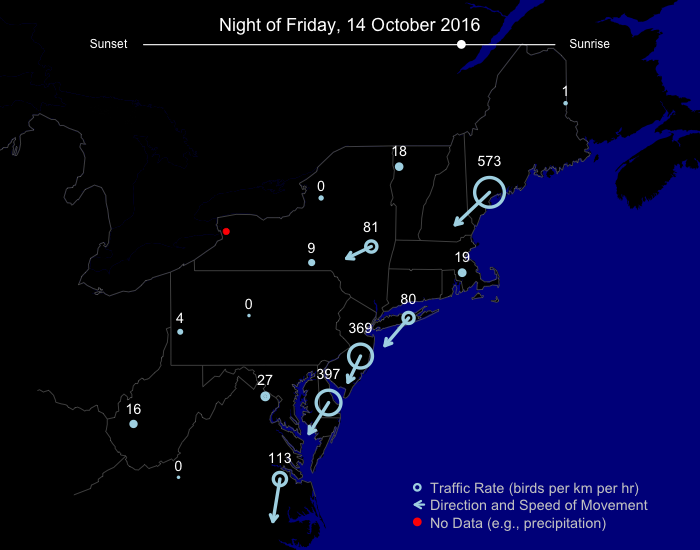
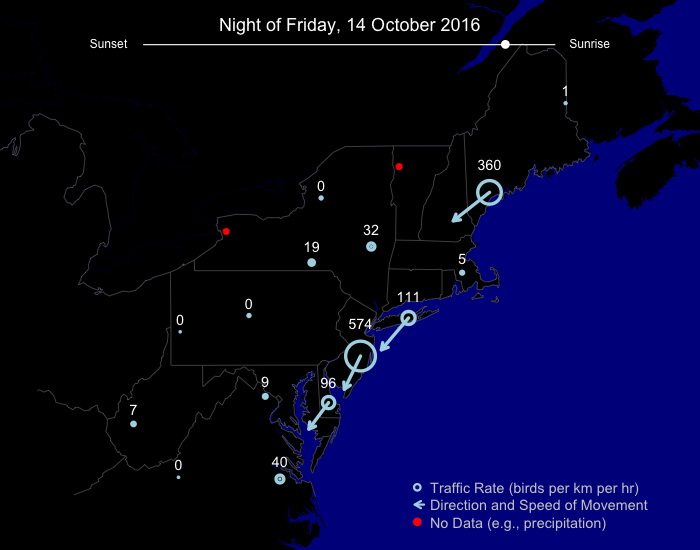
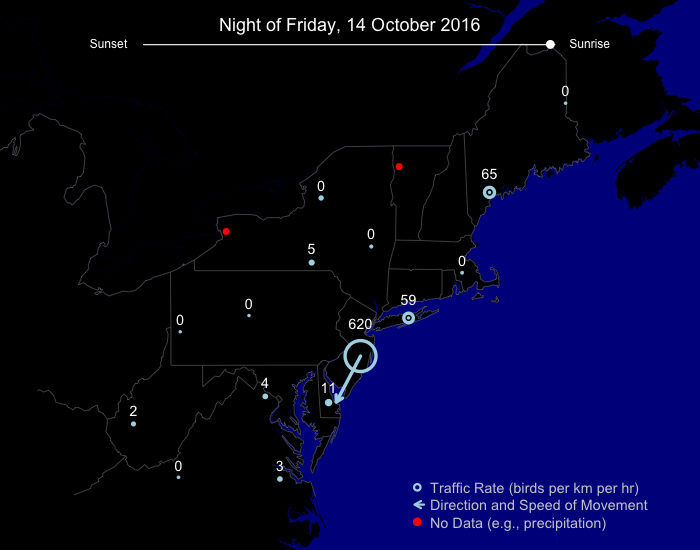

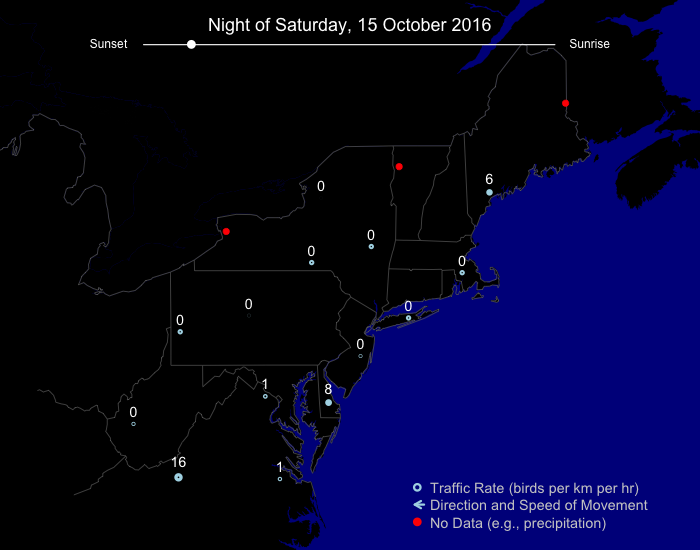

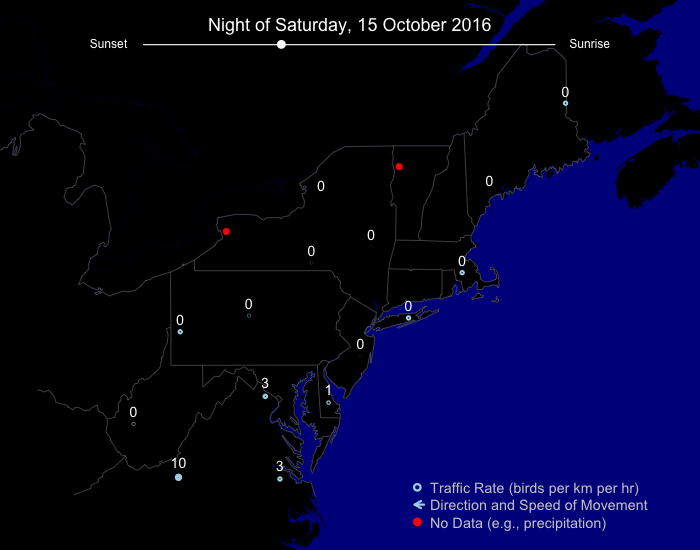
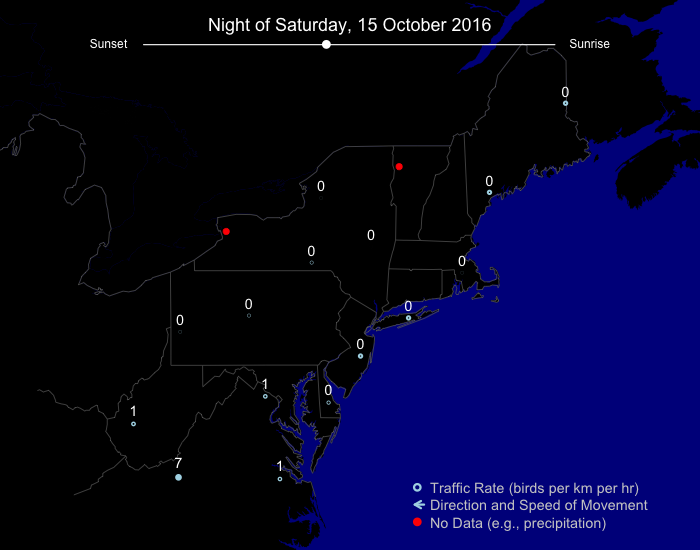
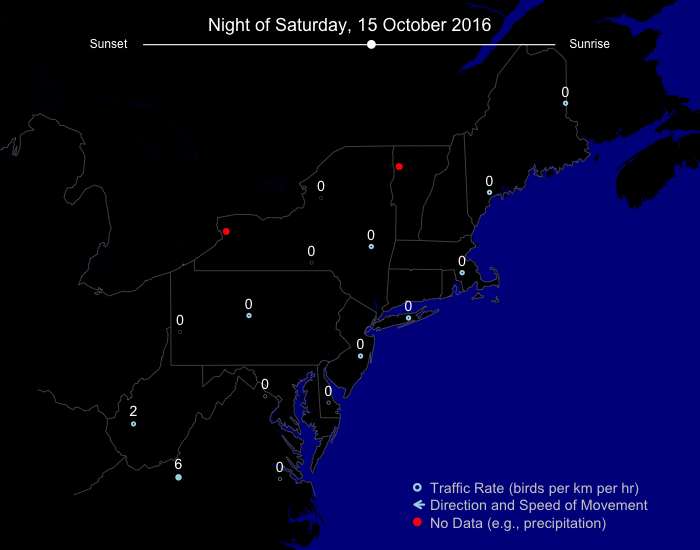
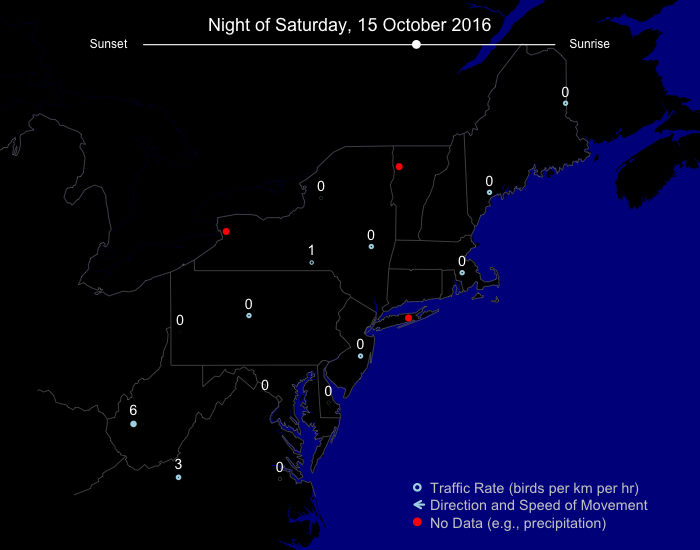


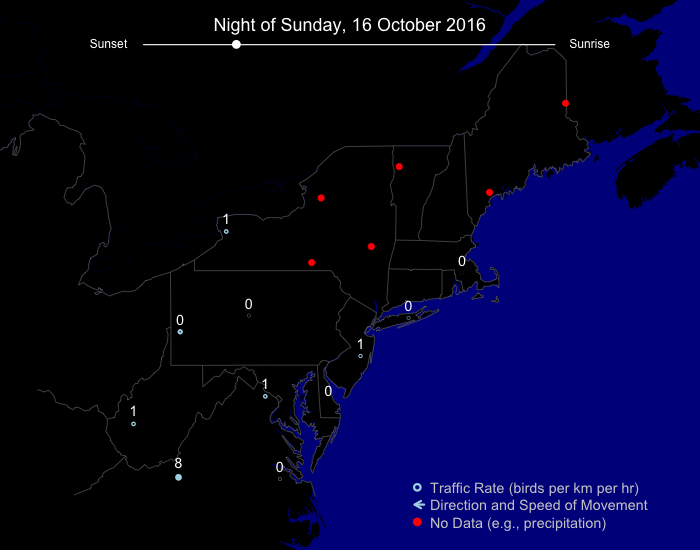
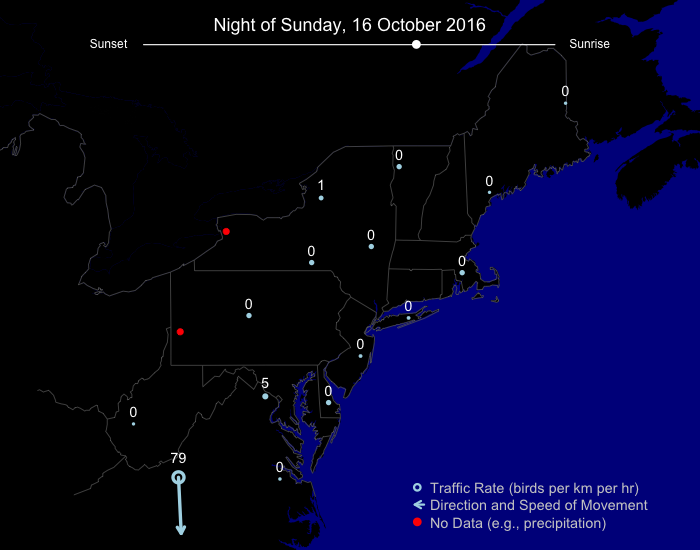


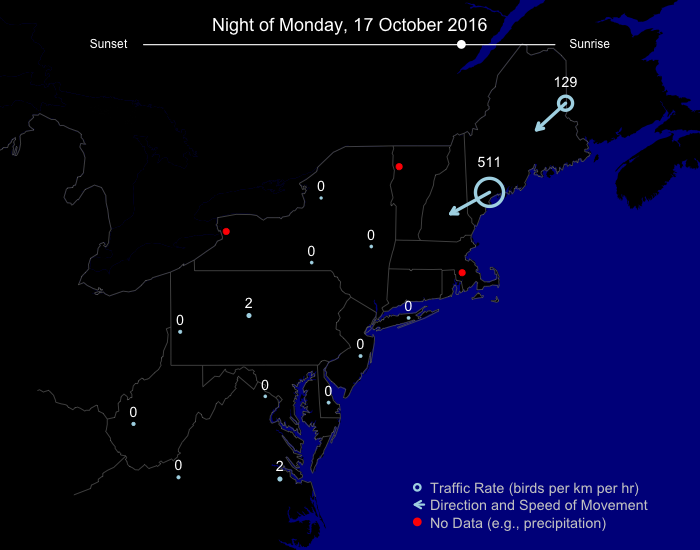


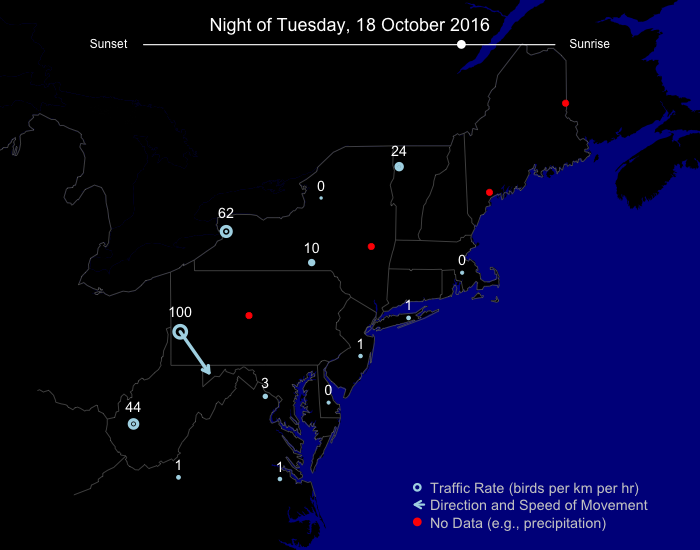
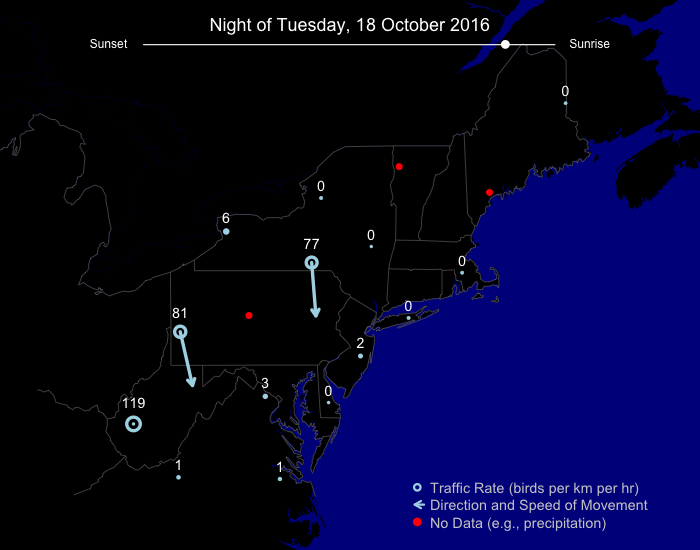
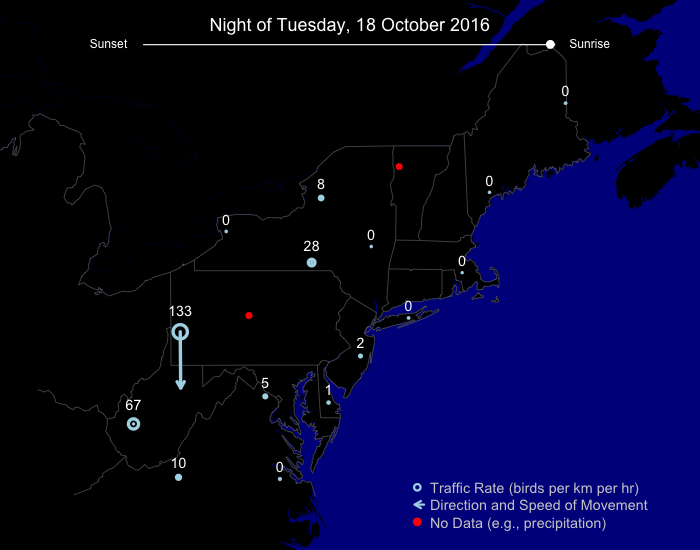
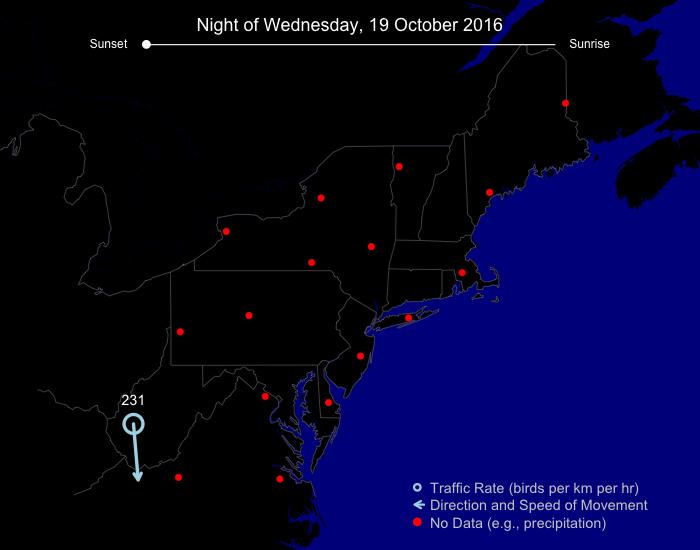
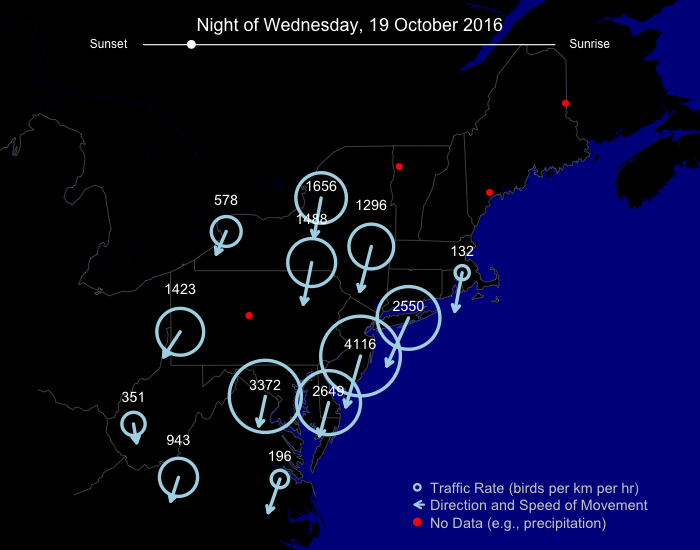
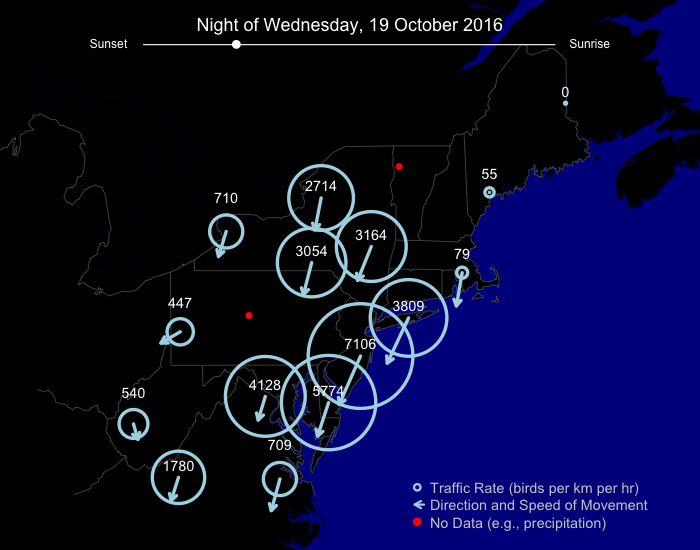
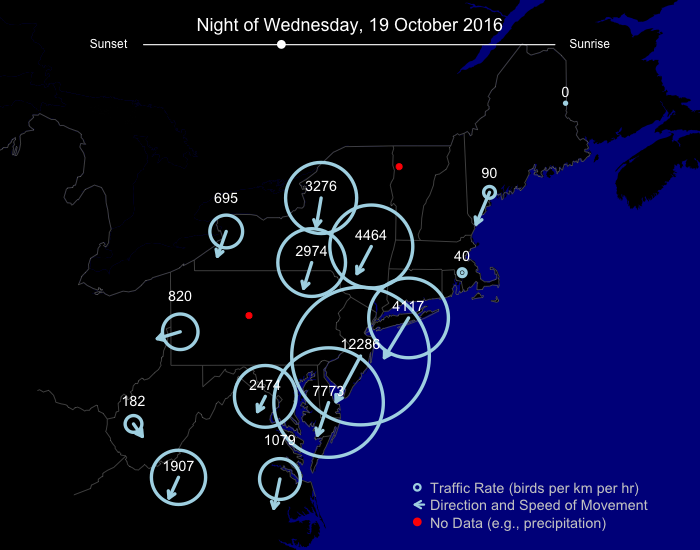
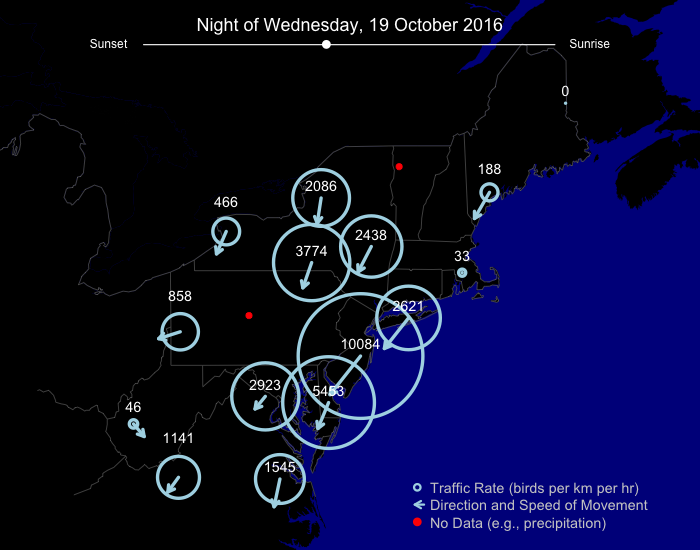
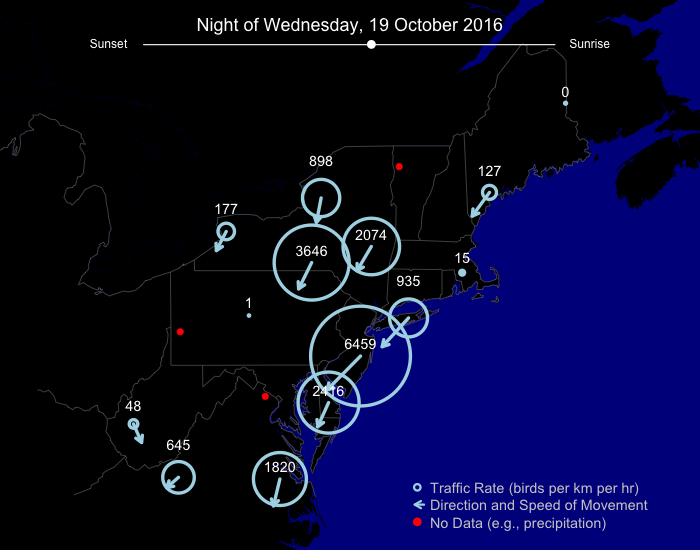
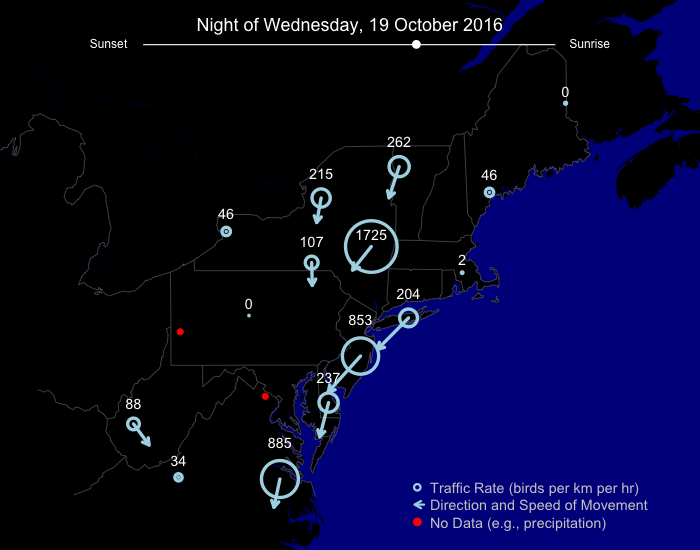
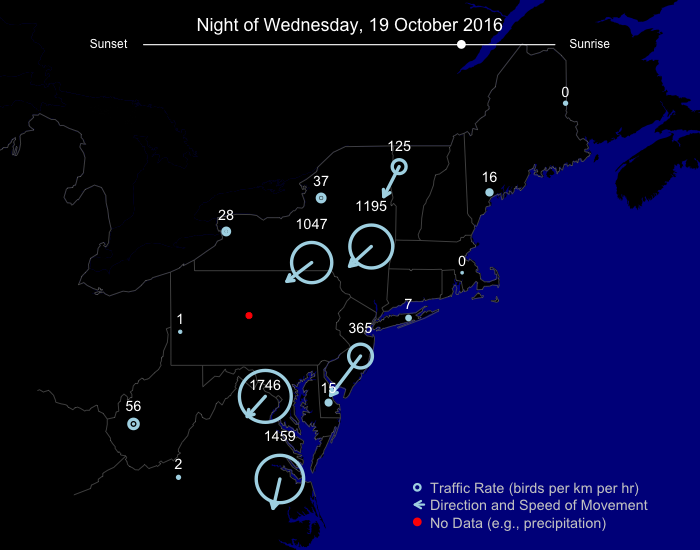
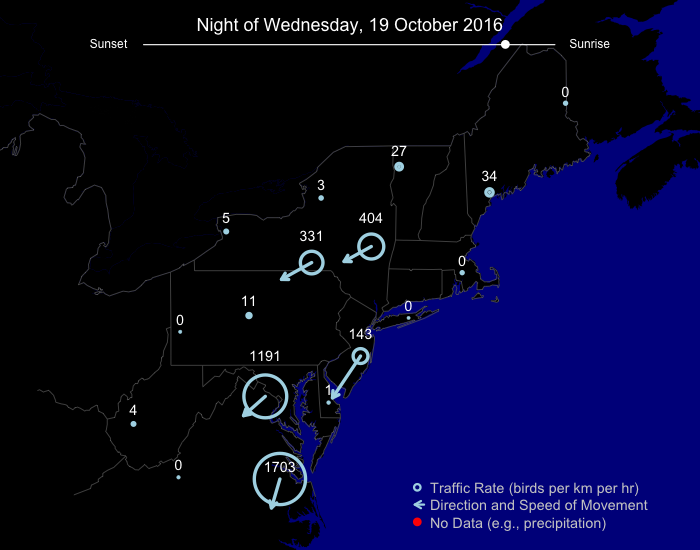
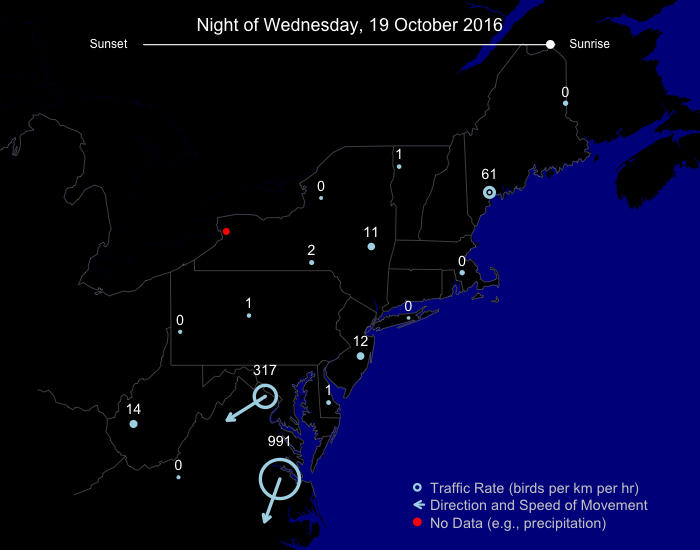
A large flight generally moving to the south occurred primarily west and south of the Hudson River on the night of 13 October. As favorable conditions for flying extend to the east on 14 October, large coastal movements occurred, primarily earlier in the night and moving in generally southwesterly directions. Then, after several days that followed of unfavorable conditions, a large pulse of migrants departed on 19 October, moving generally to the southwest and south-southwest primarily from New York to the south and west but mostly east of the Appalachians.
Background
Each night, from local sunset to local sunrise in the Eastern time zone, a BirdCast server downloads radar data from 16 stations in the northeastern US. These data are composed of every scan of the atmosphere made by these radars during this time period, with a particular focus in our case on radar reflectivity products representing the magnitude of targets (whether meteorological, like rain and hail, or biological, like birds, bats, and insects) at a given radar. A pipeline of algorithms extracts information from these radar data about birds, and the resulting bird-specific summary imagery is published daily in early afternoon eastern time (give or take).
The images you see in Traffic Reports present the migration traffic rate (MTR), direction of bird movement, and speed of bird movement. These presentations have not been reviewed by an expert, instead representing the automated output from several algorithms. Errors in the metrics are possible for approximately ~5-8% radar scans. These errors most frequently manifest as incorrect classification of precipitation or other non-biological information as birds by our automated classifier during nights with both migration and precipitation present.
For detailed information on the processing and quantification of radar data and the algorithms involved in this processing pipeline, please see our recent publication in Ecological Applications.