Welcome to this installment of BirdCast Traffic Reports, posts describing northeastern US nocturnal bird migration traffic rates, as calculated from a completely automated pipeline of algorithms. The images you see in Traffic Reports present the migration traffic rate (MTR), direction of bird movement, and speed of bird movement. See our first report or scientific paper (currently a preprint) for more information about the calculations and algorithms we use.
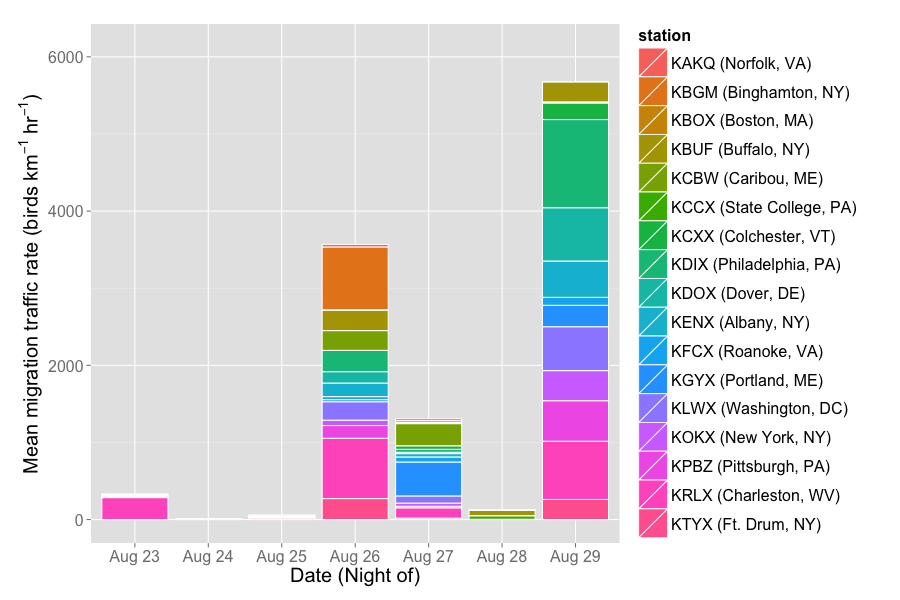
Migration Traffic Rate across the northeastern US from the night of 23 August 2016 through the morning of 30 August 2016. Note the large pulses across the region on the night of 26 and 29 August.
Nightly loops
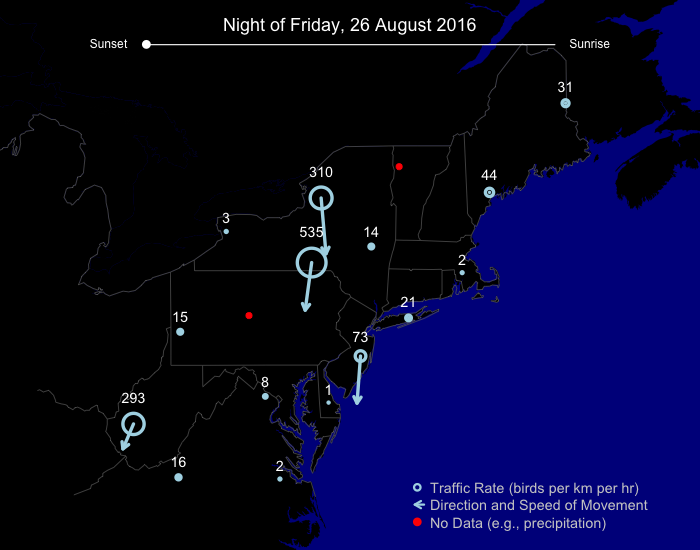
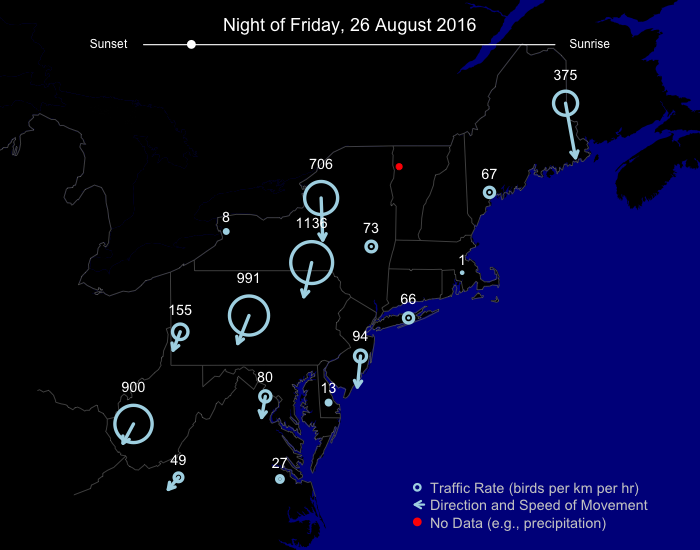
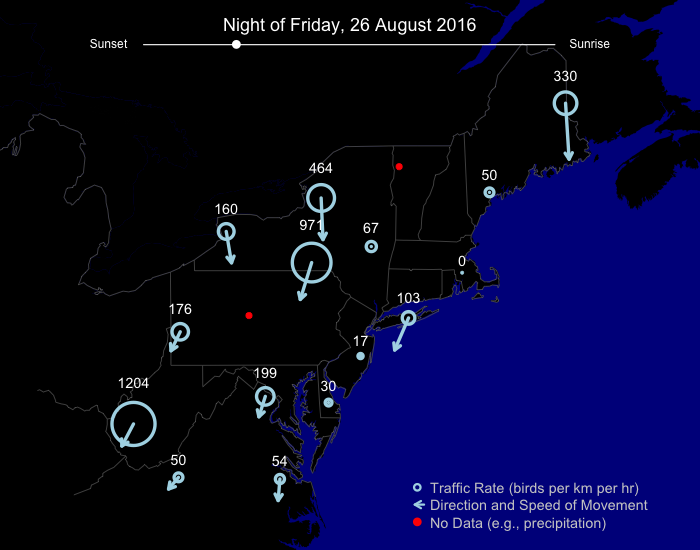
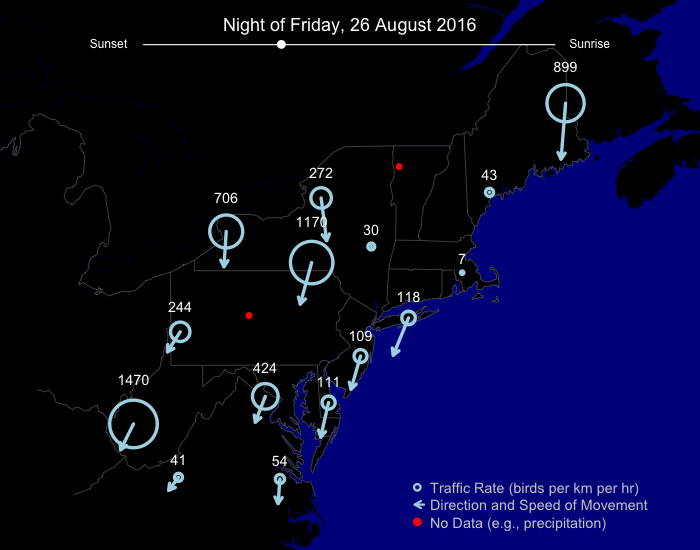
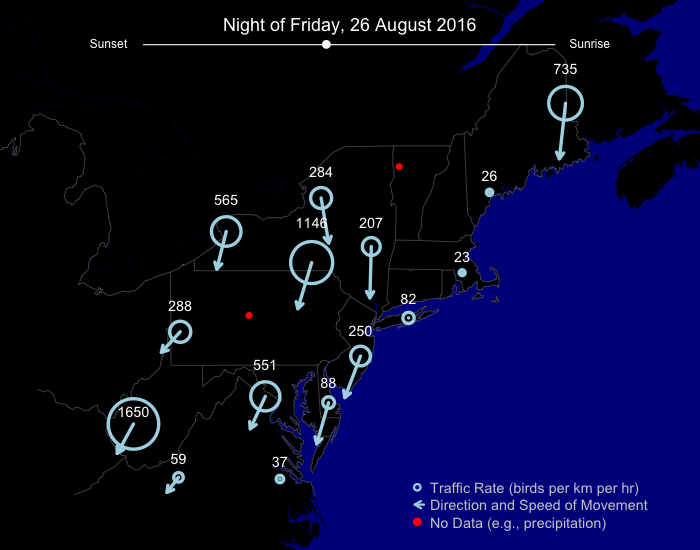
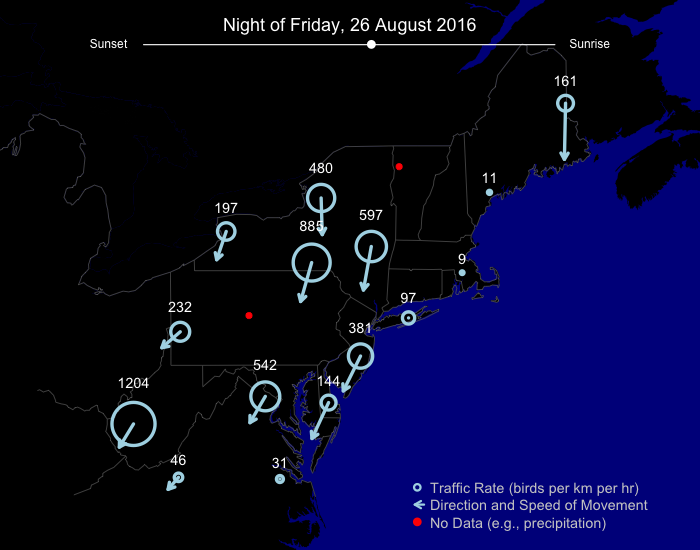
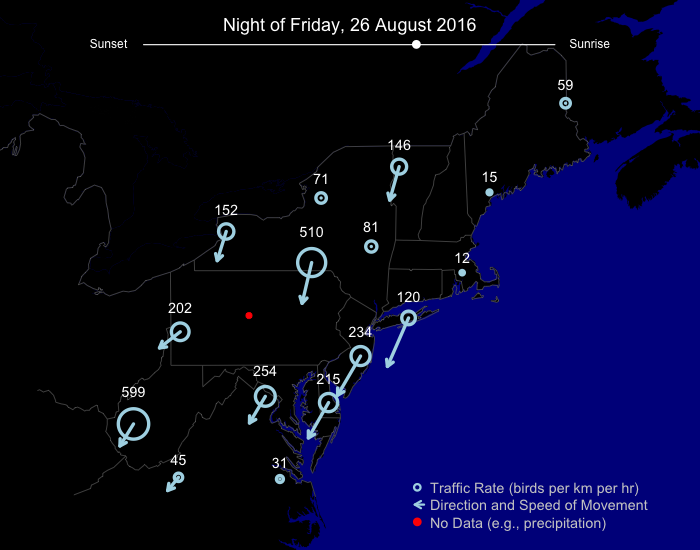
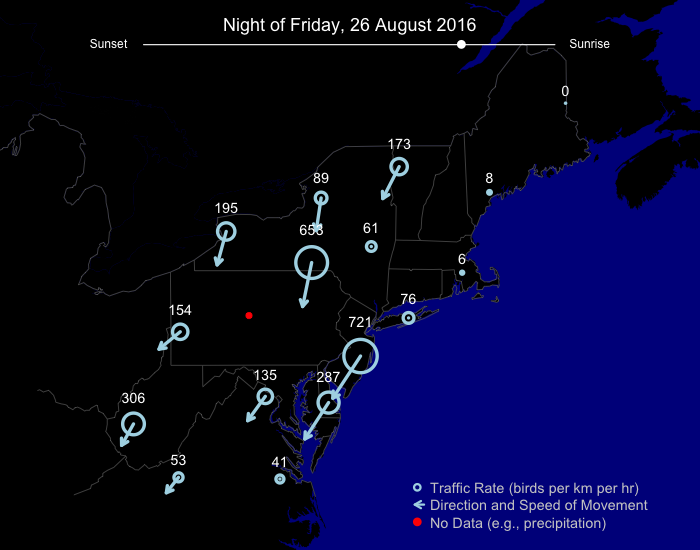
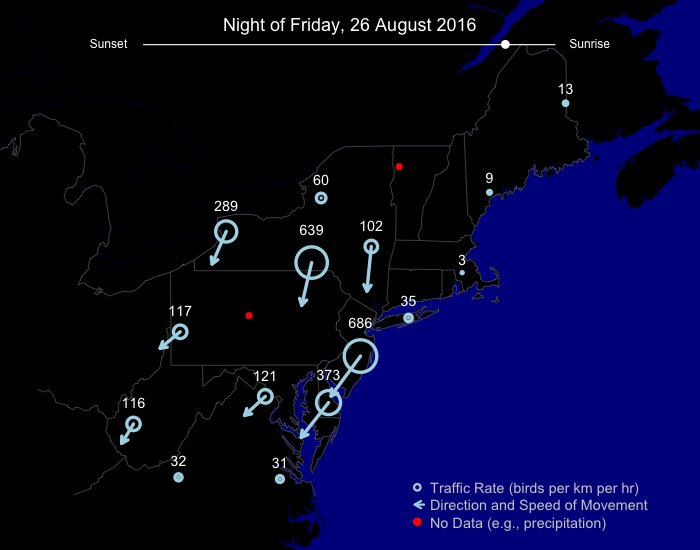
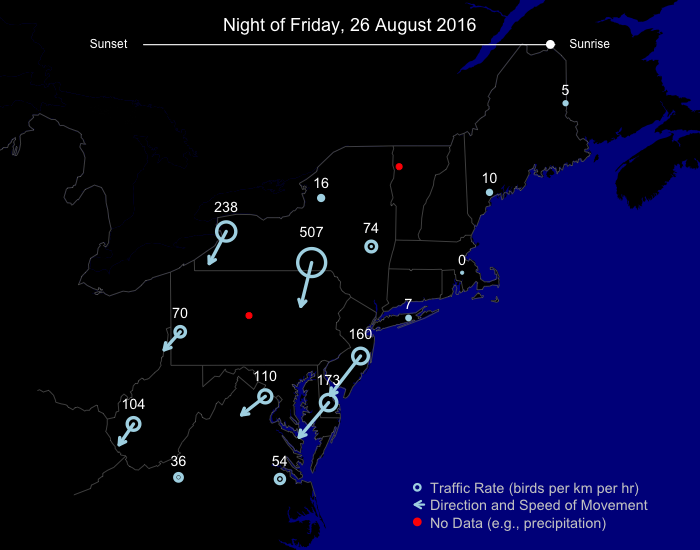
26 August 2016
Flights were particularly large on this night over more inland locations from central New York south and west into West Virginia. Note that movements are generally oriented toward south or southwest, including migrants making a jump across water from Long Island to New Jersey and DelMarVa (presumably). Later in the night, a pattern typical of nocturnal migration in the region begins to occur: birds begin to shift flight directions more westerly. This is visible particularly from stations’ data to the west and south of the Hudson River and Long Island, NY.
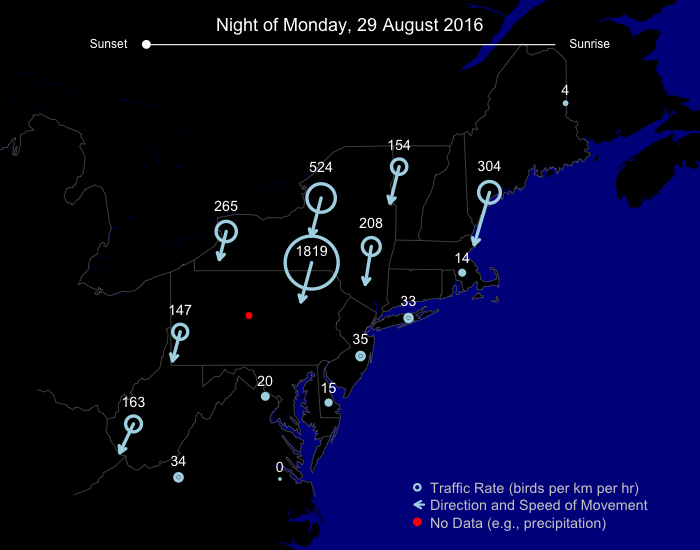
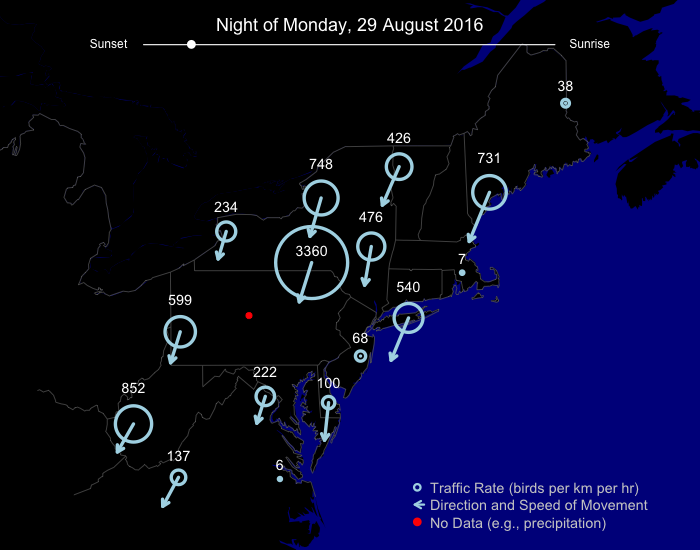
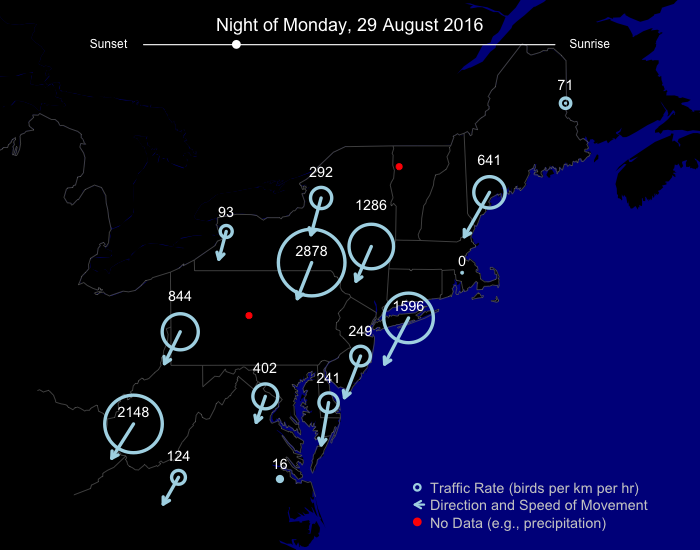
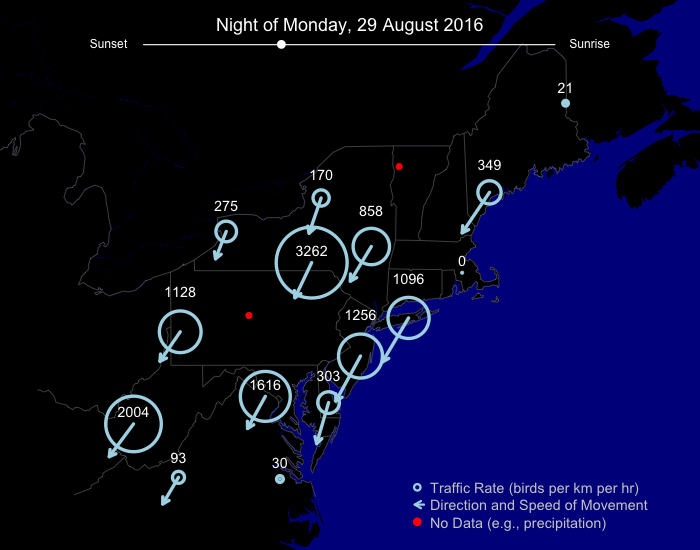
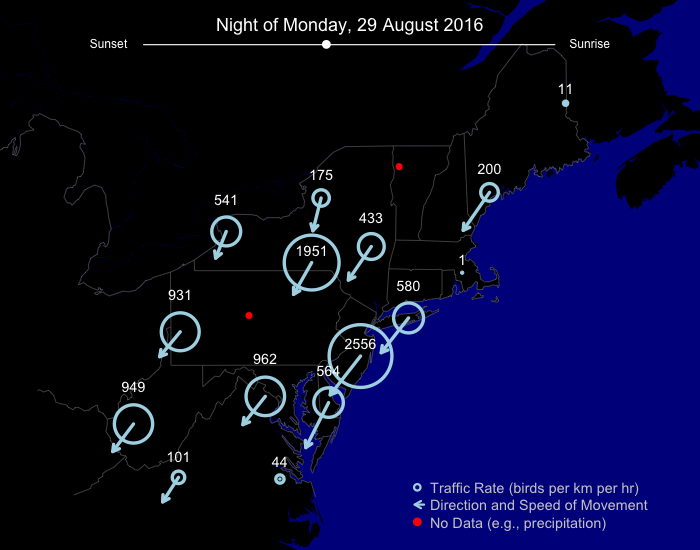
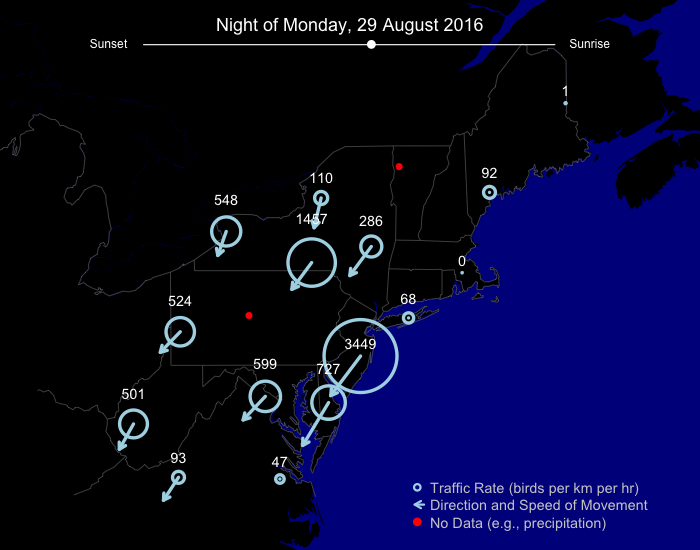
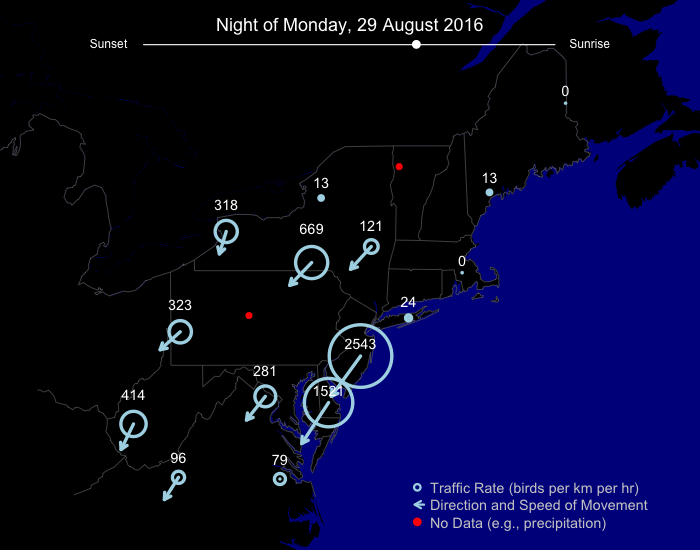
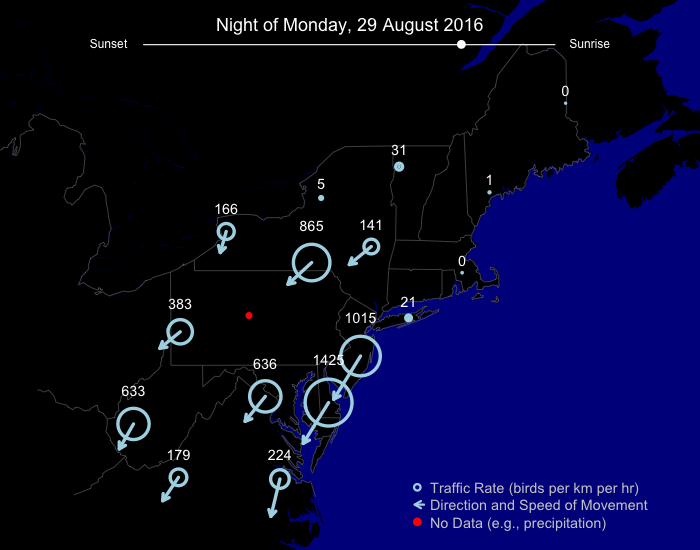
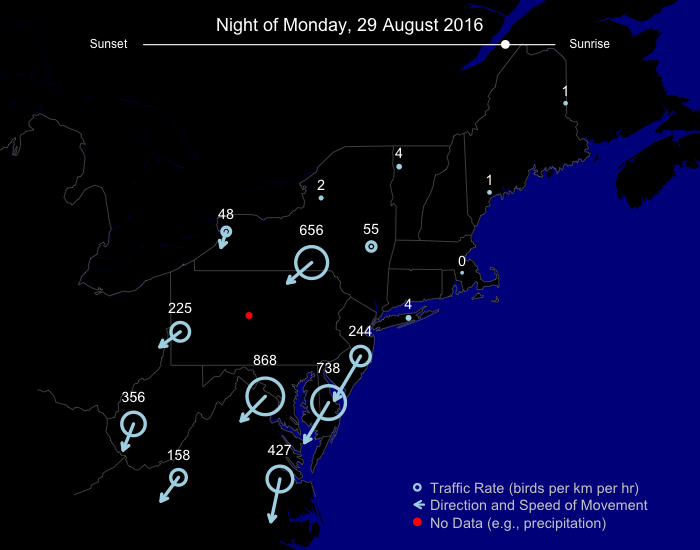
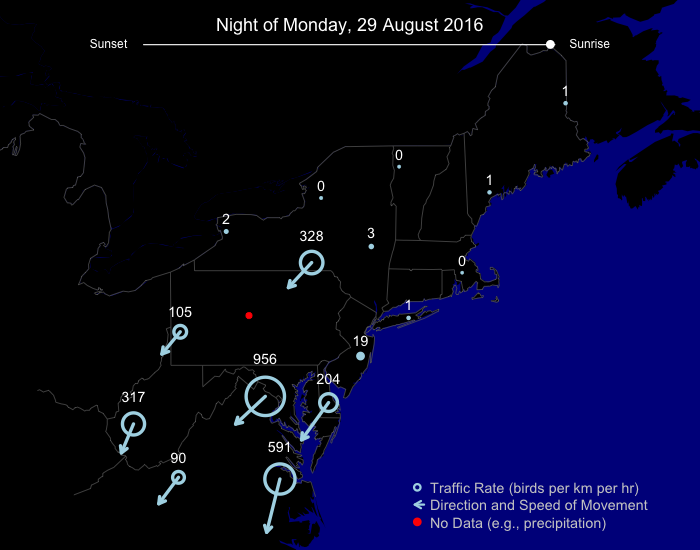
29 August 2016
A large flight occurred on this night, apparent first in more northern reaches and last in more southern reaches. Migrants generally moved in a southwesterly direction, typical of many movements during fall in the region. Note, not surprisingly given high pressure over the western North Atlantic and calm or somewhat easterly surface winds, there is no indication of trans-Atlantic takeoffs that sometimes characterize flight directions in coastal areas during this time of the year.
Species on the move
The following species were on the move across the region during the period. Additional information will appear later this week in our weekly regional migration analysis post.
Increasing
| Species | Increase from Last Week | % of Checklists Reporting |
|---|---|---|
| Buff-breasted Sandpiper | 501% | 3.3 |
| Magnolia Warbler | 127% | 4.2 |
| American Redstart | 34% | 11.6 |
| Tennessee Warbler | 82% | 3.3 |
| Wilson's Warbler | 185% | 1.5 |
| Common Nighthawk | 36% | 7.1 |
| Nashville Warbler | 60% | 2.8 |
| Warbling Vireo | 39% | 6.3 |
| American Golden-Plover | 145% | 1.2 |
| Sanderling | 47% | 6.1 |
| Swainson's Thrush | 166% | 1.2 |
| Chestnut-sided Warbler | 28% | 5.6 |
| Blackburnian Warbler | 45% | 2.7 |
| Least Flycatcher | 42% | 3 |
| Blackpoll Warbler | 185% | 0.8 |
| Black-throated Green Warbler | 59% | 2.6 |
| Red-eyed Vireo | 21% | 18.4 |
| Red-breasted Nuthatch | 28% | 7.2 |
| Black-and-white Warbler | 20% | 8.2 |
| Yellow-throated Vireo | 53% | 2.3 |
| Philadelphia Vireo | 150% | 0.6 |
| Yellow-bellied Flycatcher | 65% | 1.2 |
| White-eyed Vireo | 33% | 2.9 |
Background
Each night, from local sunset to local sunrise in the Eastern time zone, a BirdCast server downloads radar data from 16 stations in the northeastern US. These data are composed of every scan of the atmosphere made by these radars during this time period, with a particular focus in our case on radar reflectivity products representing the magnitude of targets (whether meteorological, like rain and hail, or biological, like birds, bats, and insects) at a given radar. A pipeline of algorithms extracts information from these radar data about birds, and the resulting bird-specific summary imagery is published daily in early afternoon eastern time (give or take).
The images you see in Traffic Reports present the migration traffic rate (MTR), direction of bird movement, and speed of bird movement. These presentations have not been reviewed by an expert, instead representing the automated output from several algorithms. Errors in the metrics are possible for approximately ~5-8% radar scans. These errors most frequently manifest as incorrect classification of precipitation or other non-biological information as birds by our automated classifier during nights with both migration and precipitation present.
For detailed information on the processing and quantification of radar data and the algorithms involved in this processing pipeline, please see our recent publication in Ecological Applications.