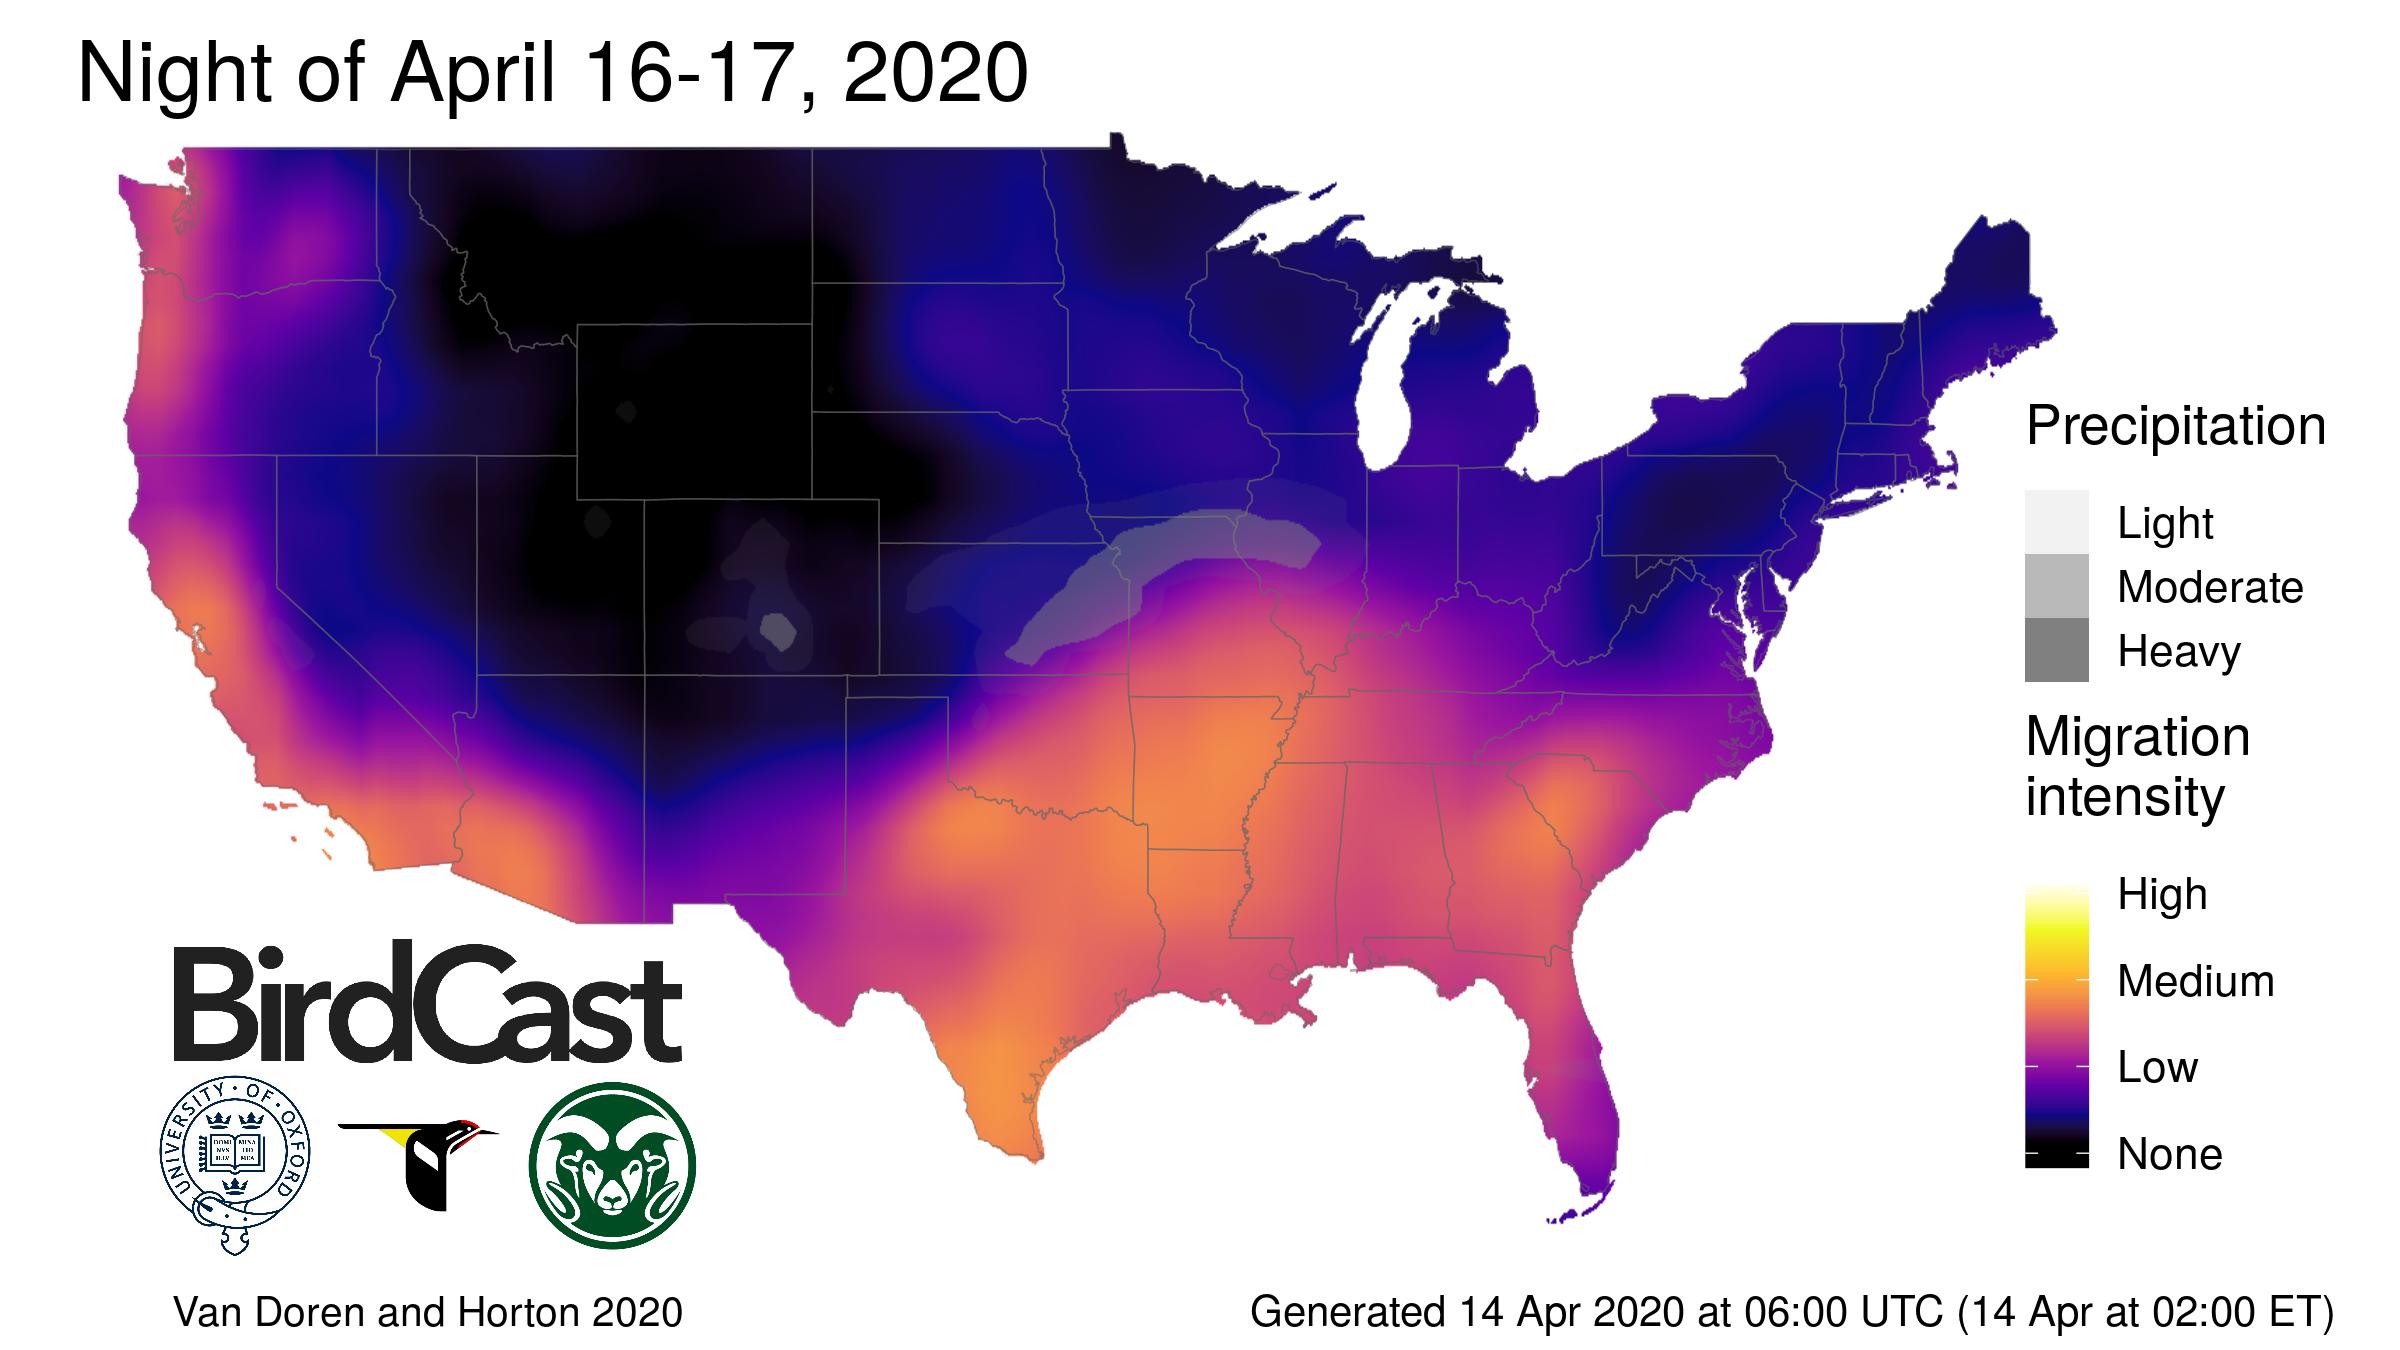
Update: We have further updated the color scheme on 13 April 2020 to add more contrast to the palette. We thank the Birding Memes page on Facebook for feedback (and witty criticism …).
Some of you may have noticed changes on 9 and 13 April 2020 to the look of the BirdCast migration forecast map. We received suggestions that our color palette for these visualizations, in particular the scale representing migration intensity, could be insufficient for viewers with green-, red-, or blue-color blindness. Furthermore, our existing scale was not perceptually uniform in color and black-and-white.
Recent explorations by several on the extended team, most visibly by Dr. Kyle Horton at Colorado State University, highlighted a more broadly applicable color scale, referenced in several recent publications (see this and this) and a number of applications. So as of this evening, we have this new color scheme deployed to our live maps!
With this change in color scale, Team BirdCast also gains an added alignment of its visuals with those of CSU’s AeroEco Lab.