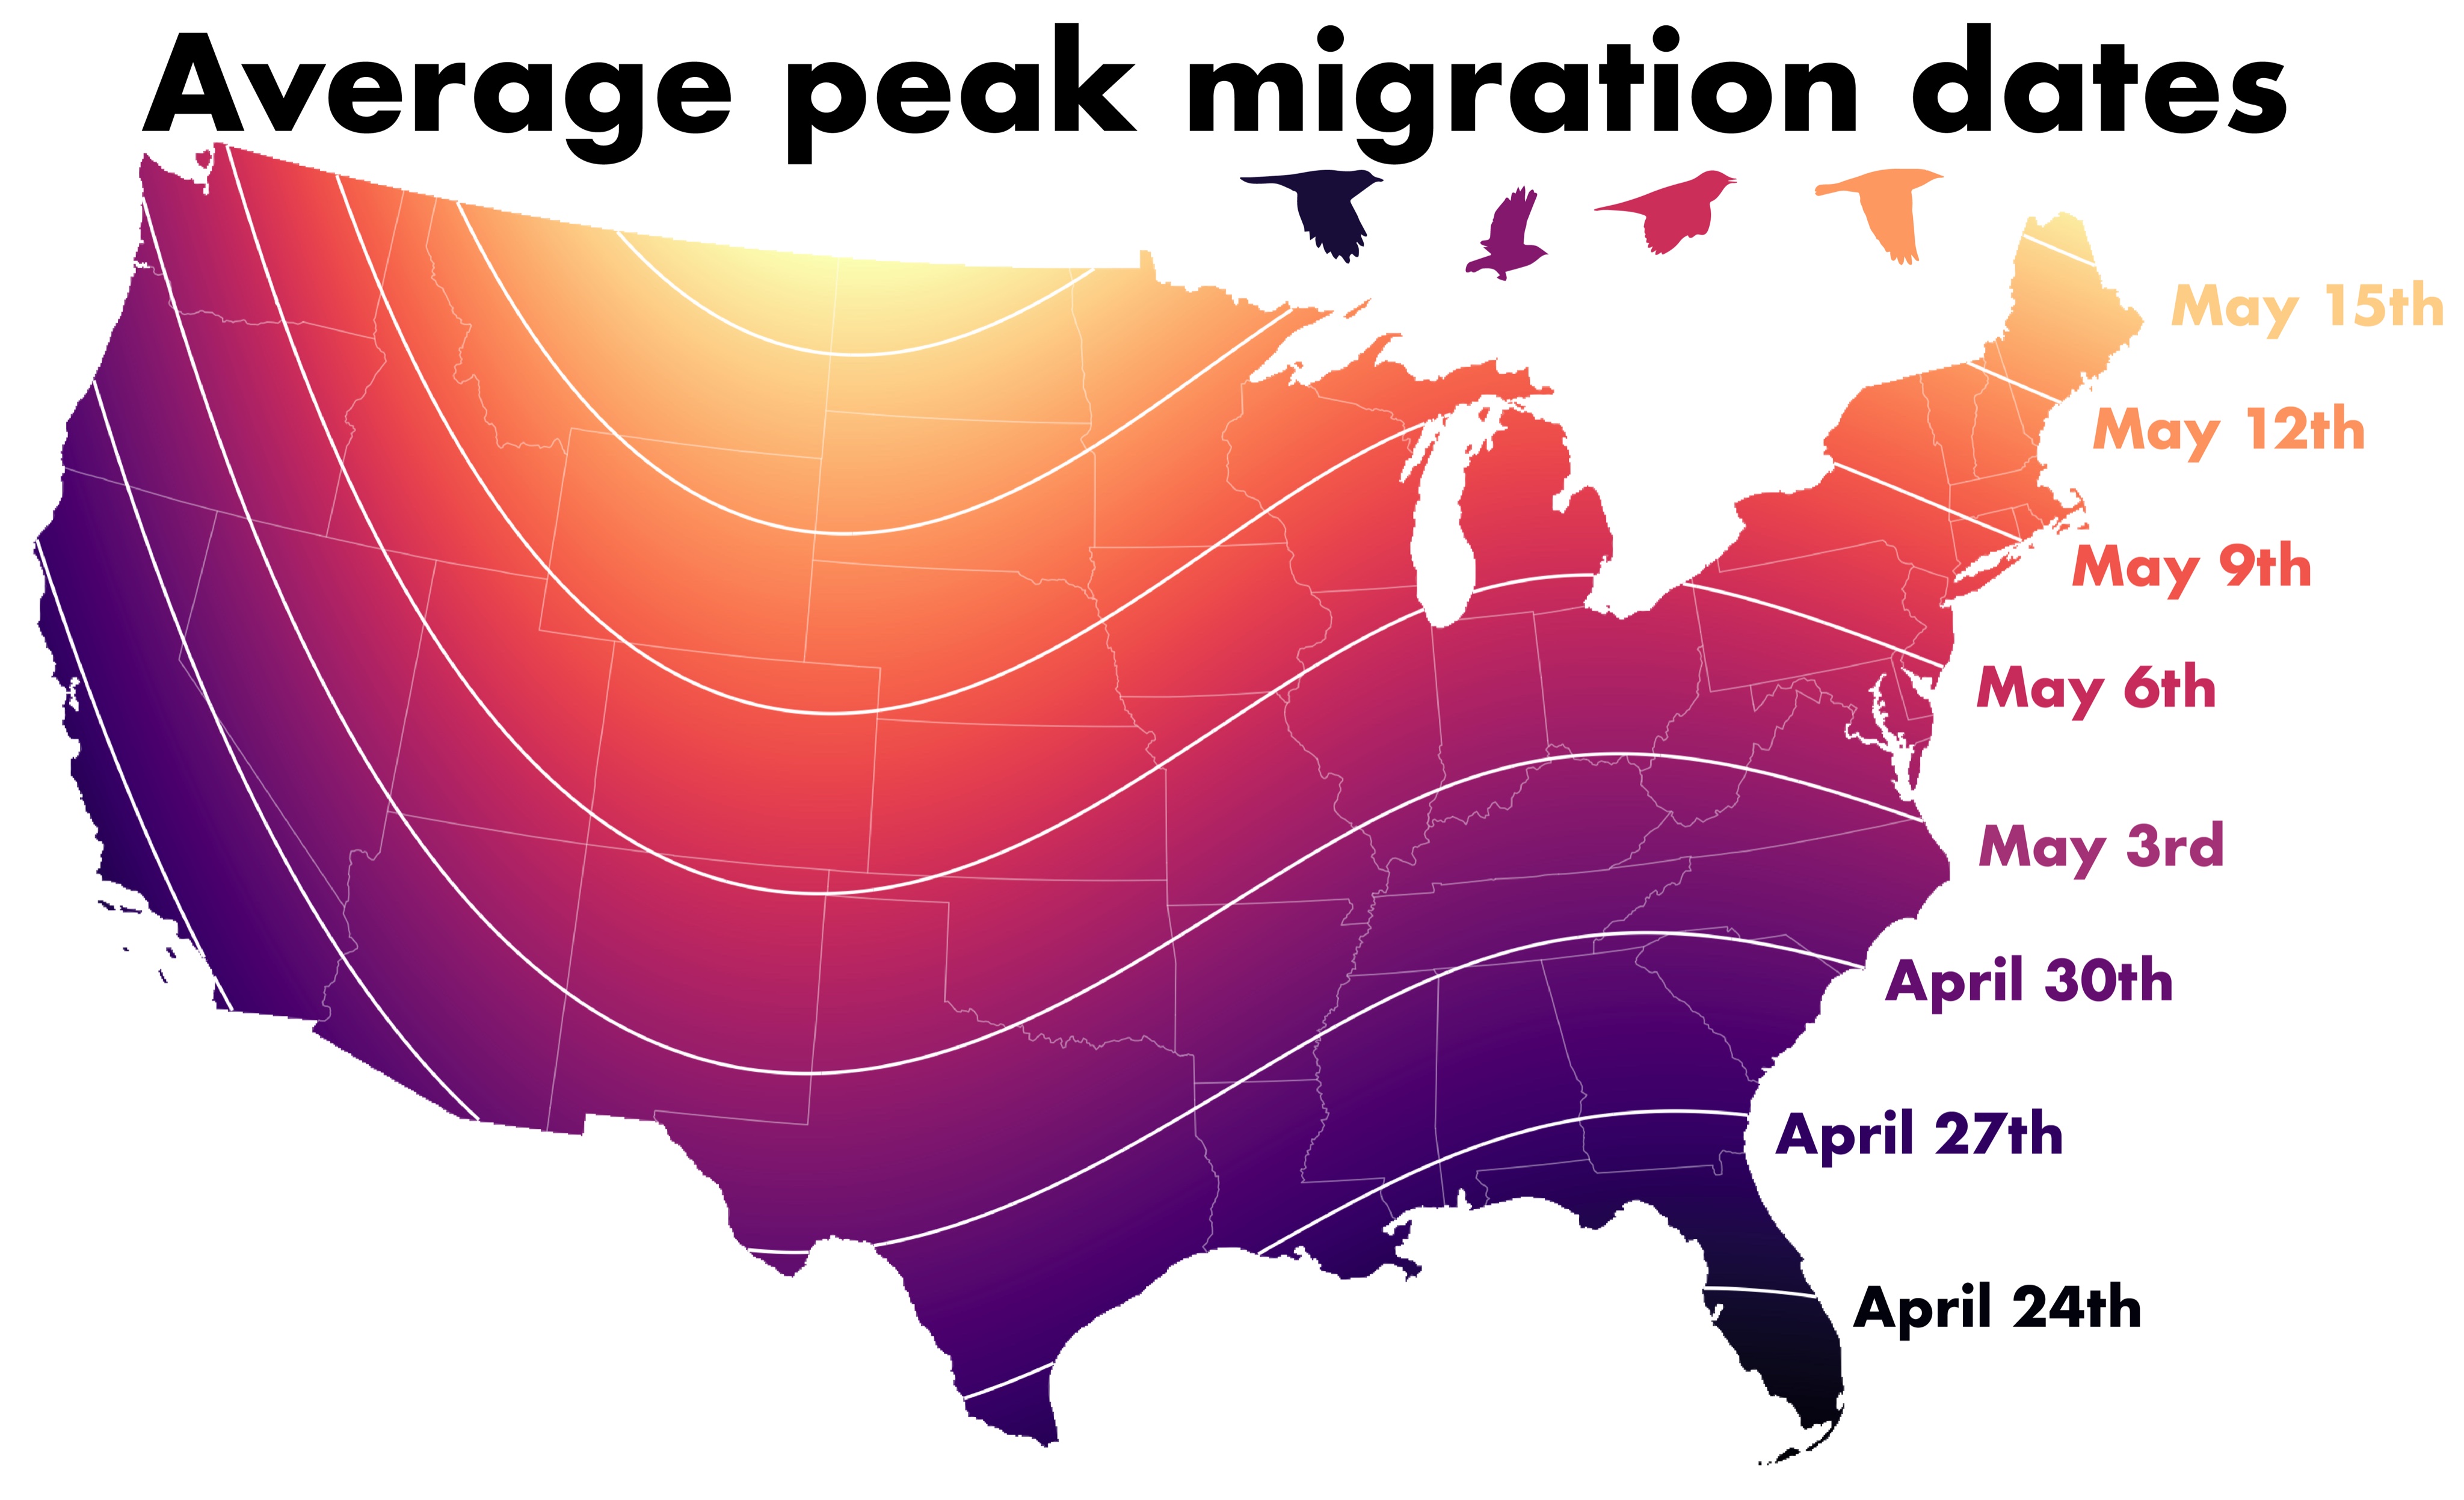
One of the highlights of studying migration in the era of Big Data is the opportunity to characterize patterns at large spatial and temporal scales that involve billions of moving organisms! We can quantify the seasonal abundance of nocturnal bird migration above the continent, we can identify where the greatest risks of exposing these migrants to light pollution occurs, and we can forecast the timing of peak migration. Speaking of which: peak migration periods in many areas of the contiguous US are approaching. This figure from the CSU AeroEco Lab depicts a coarse rule of thumb to guide your efforts to experience this massive movement of animals from your porches, windows, back yards, and rooftops. The contours represent lines of constant dates, all of which were derived from over two decades of radar data.


