The following “traffic report” describes northeast US nocturnal bird migration traffic rates, as calculated from a completely automated pipeline of algorithms. The images you see in Traffic Reports present the migration traffic rate (MTR), direction of bird movement, and speed of bird movement. See our first report or scientific paper (currently a preprint) for more information about the calculations and algorithms we use.
Migration over the last week
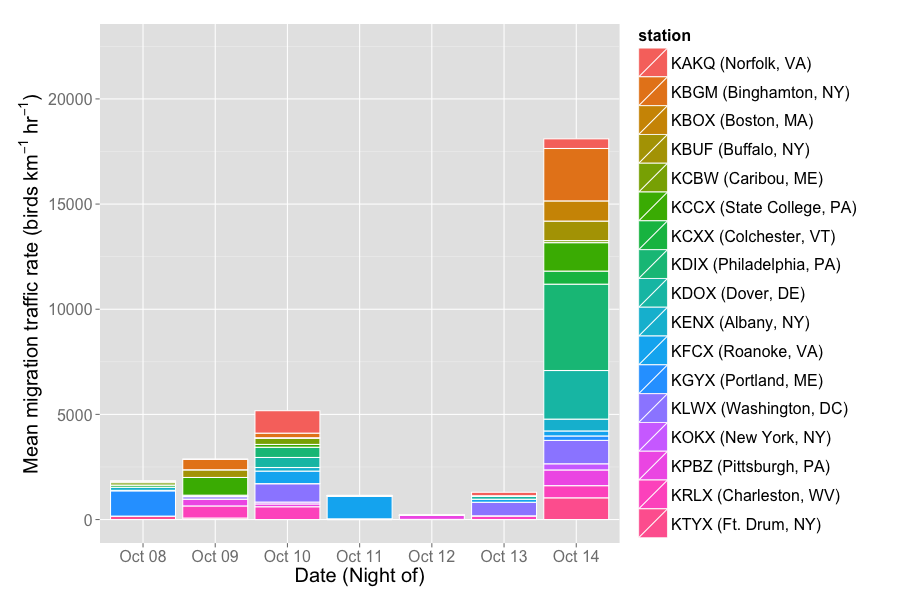
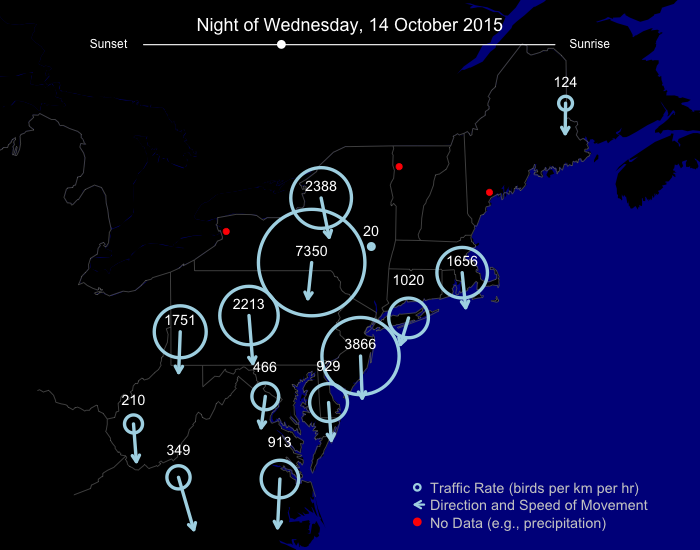
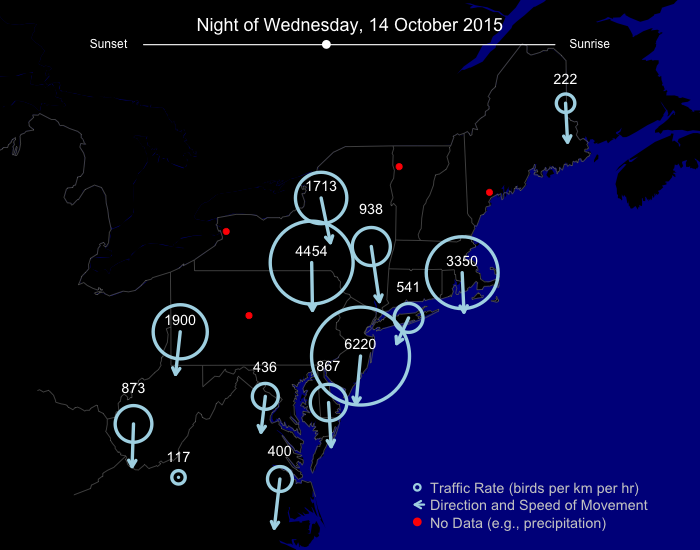
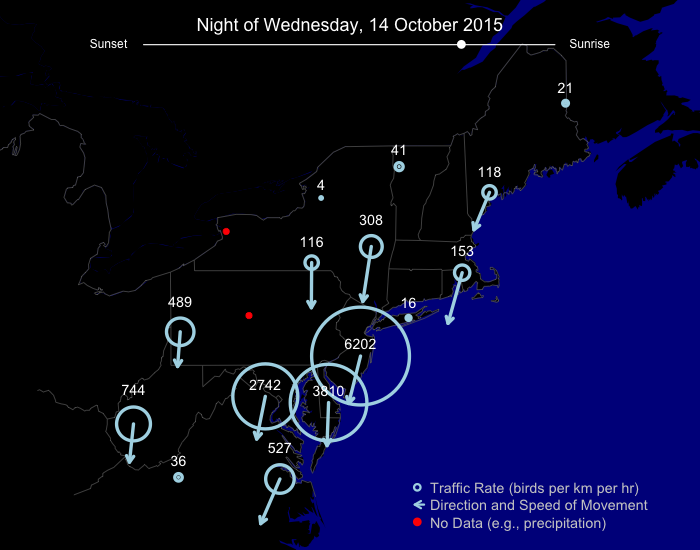
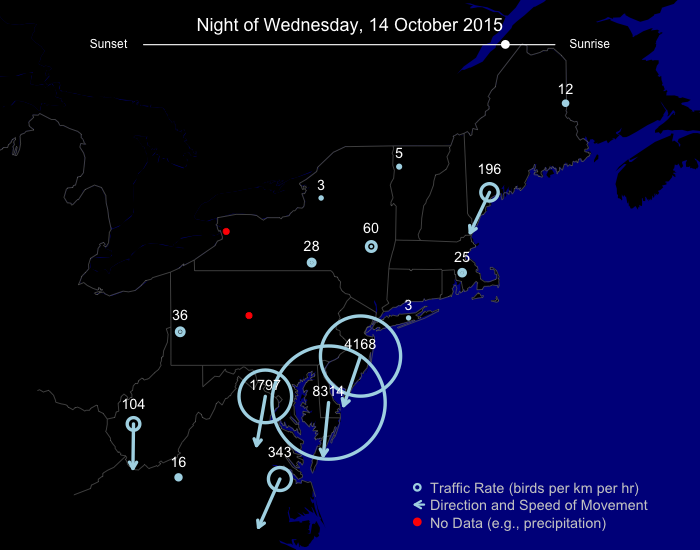
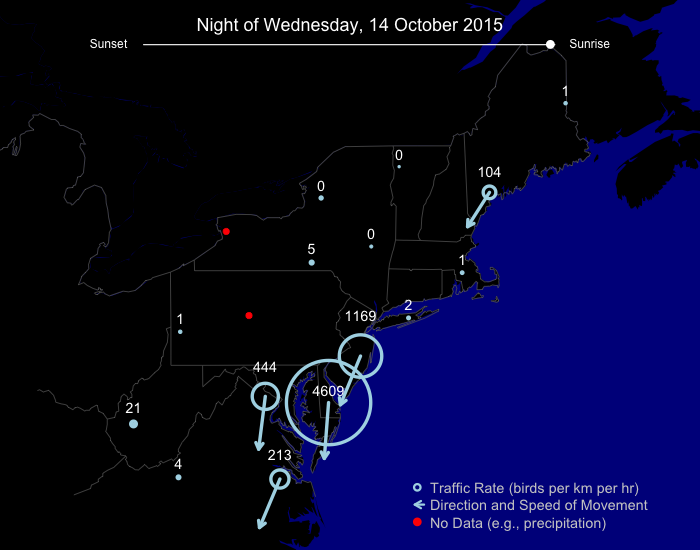
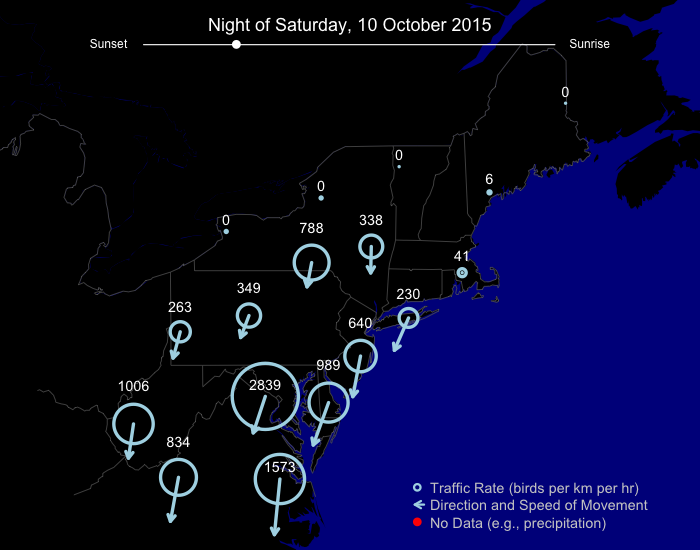
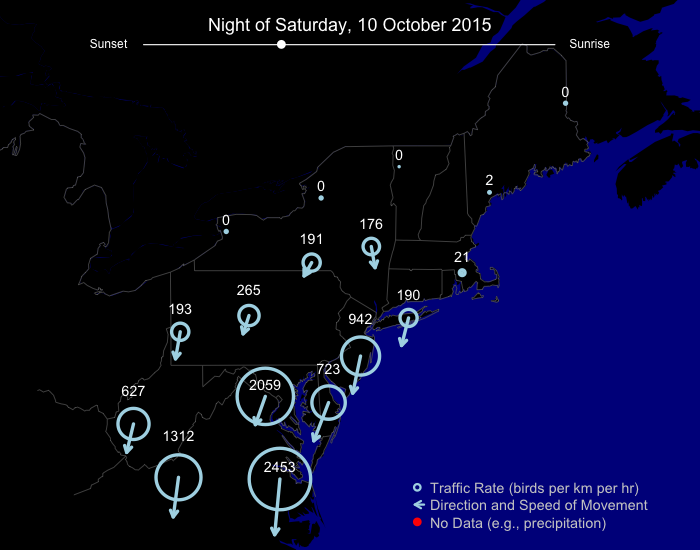
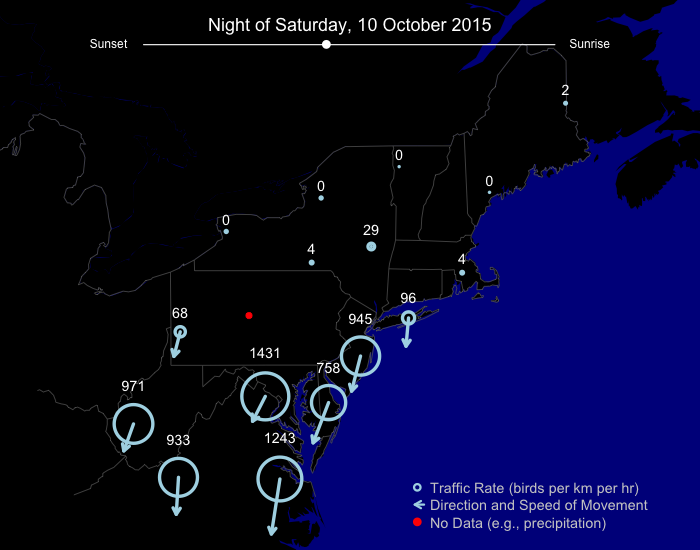
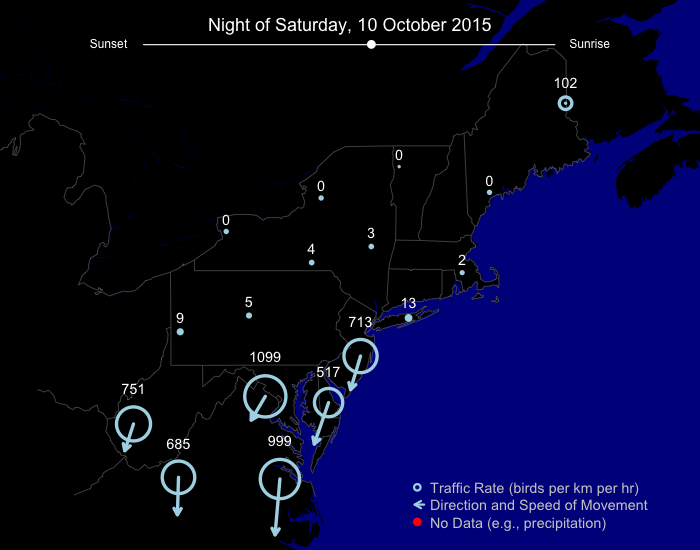
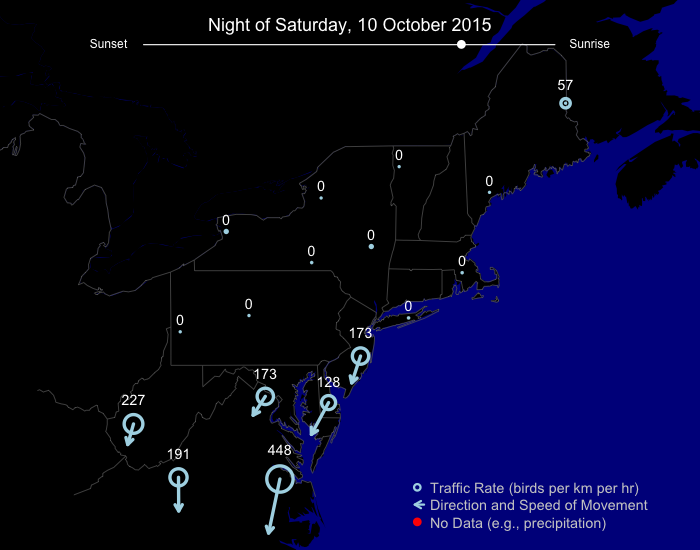
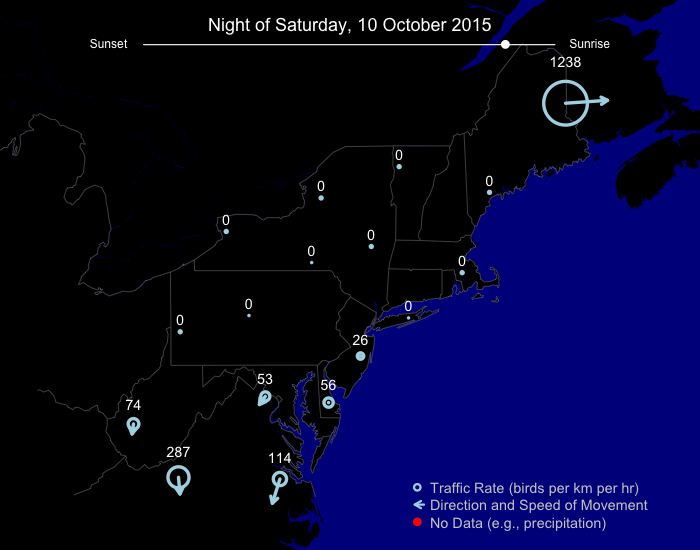
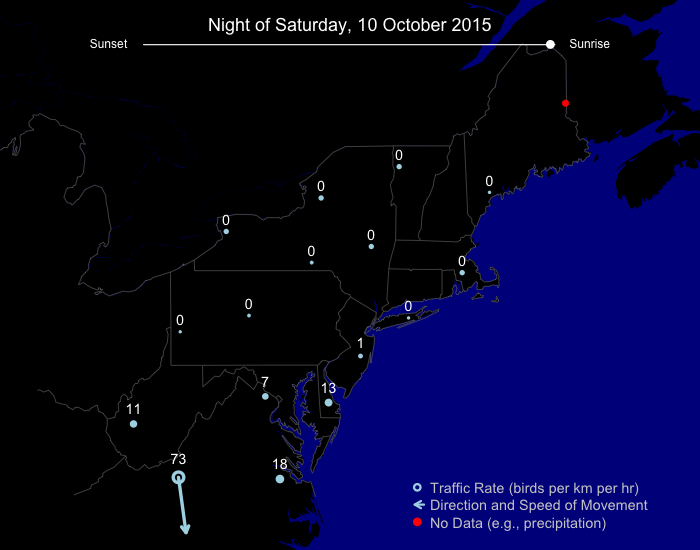
Migration events between 8-14 October were varied, with the largest movement of the period by far occurring recently, on Wednesday night. Last Saturday night also experienced a respectable movement. Remember, migration traffic rate is defined as the number of birds from 0-3,000 meters above radar stations moving hourly over a 1 km line drawn on the ground.
Nightly migration loops
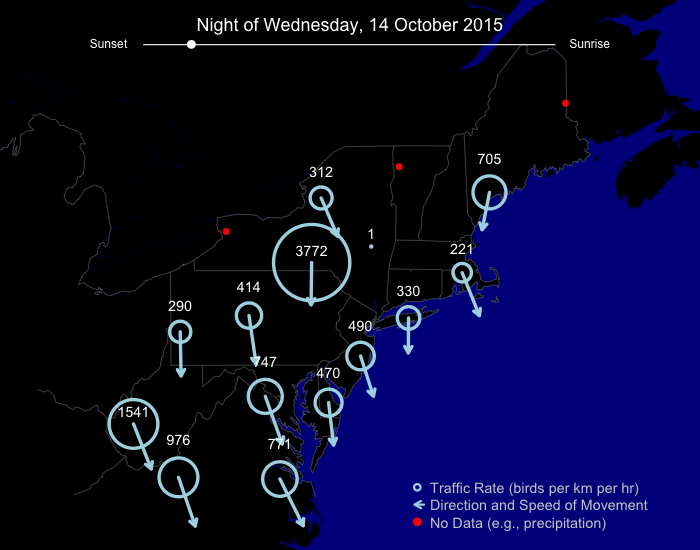
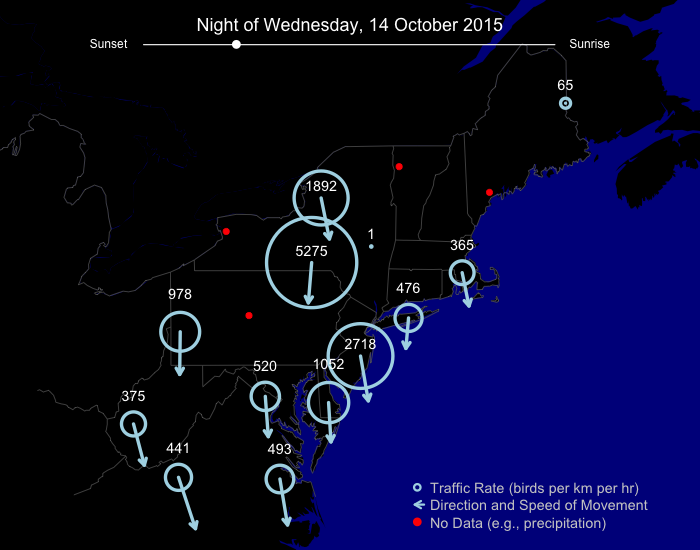
By far the greatest migration occurred on the night of Wednesday, 14 October.
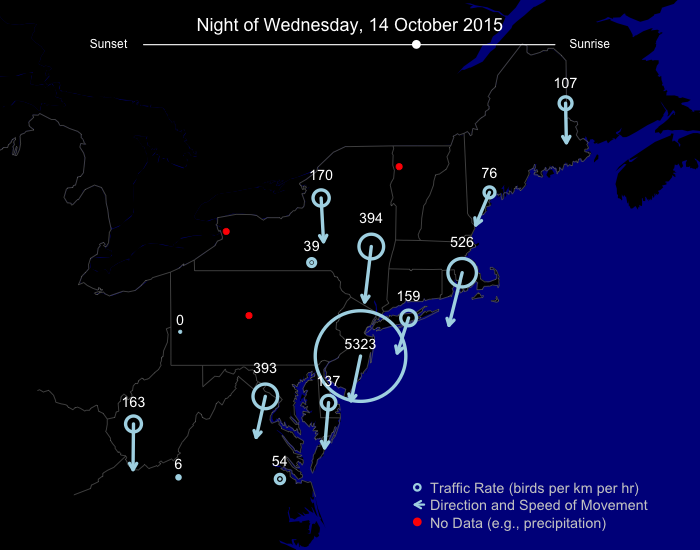
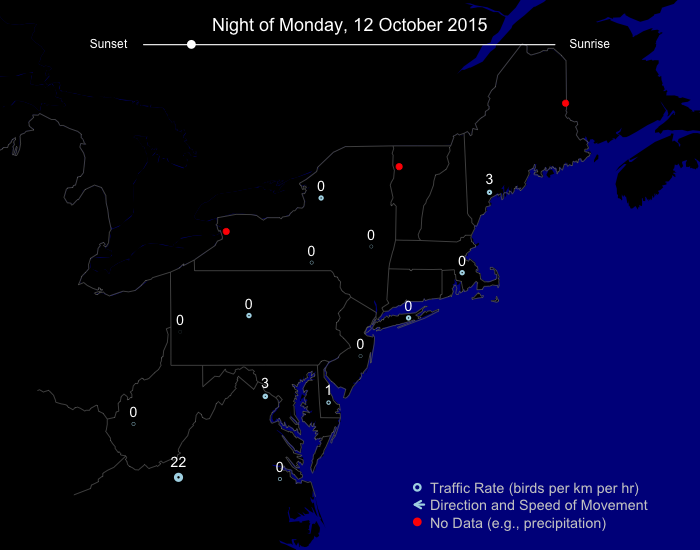
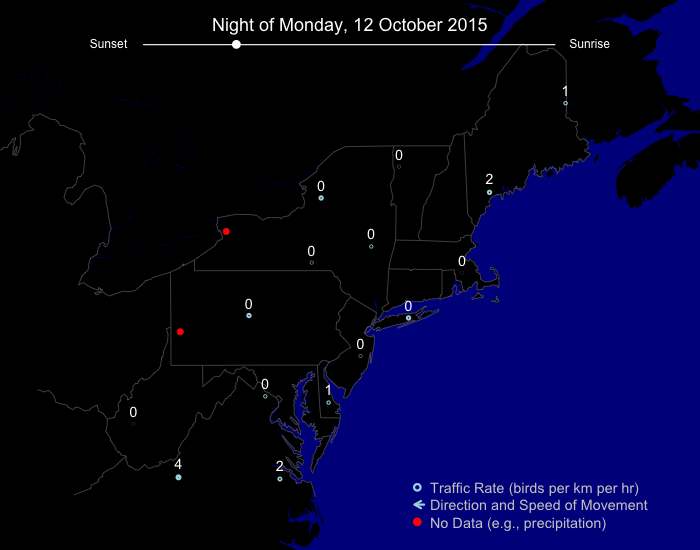
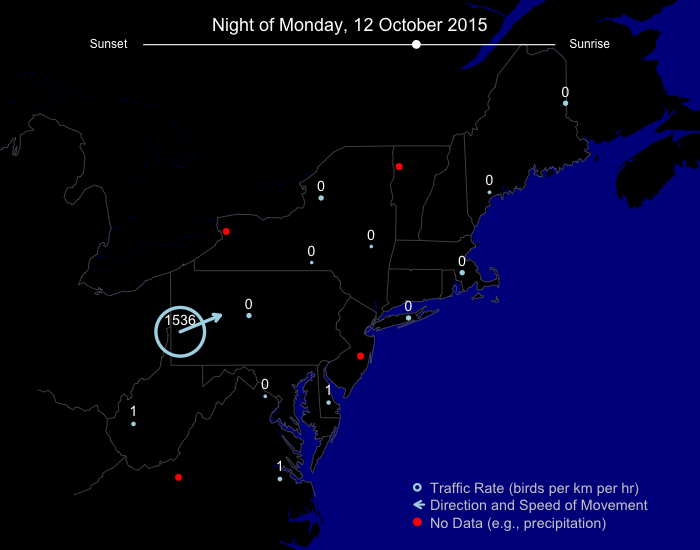
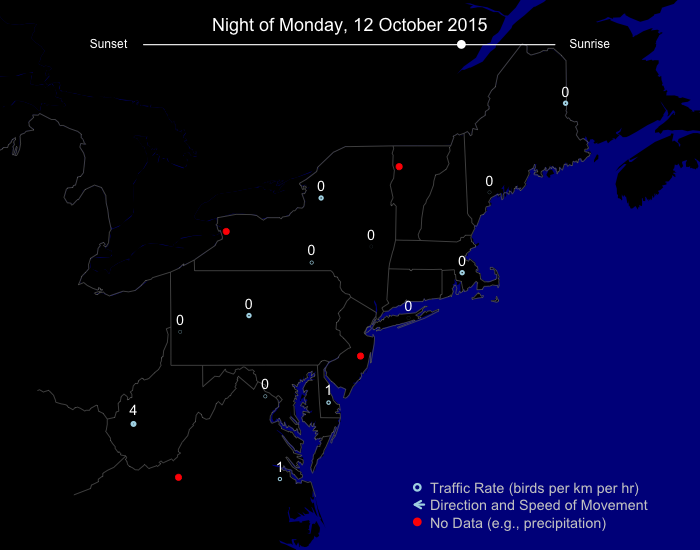
This makes sense, as the preceding nights experienced little in the way of bird movements. For example, the night of 12 October:


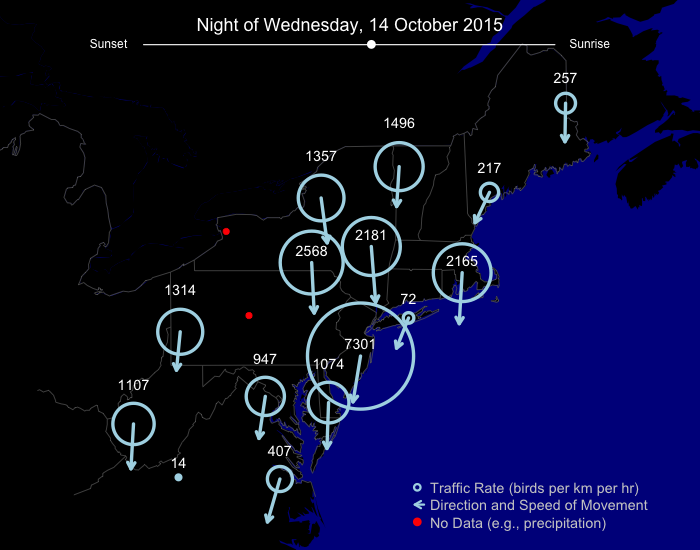
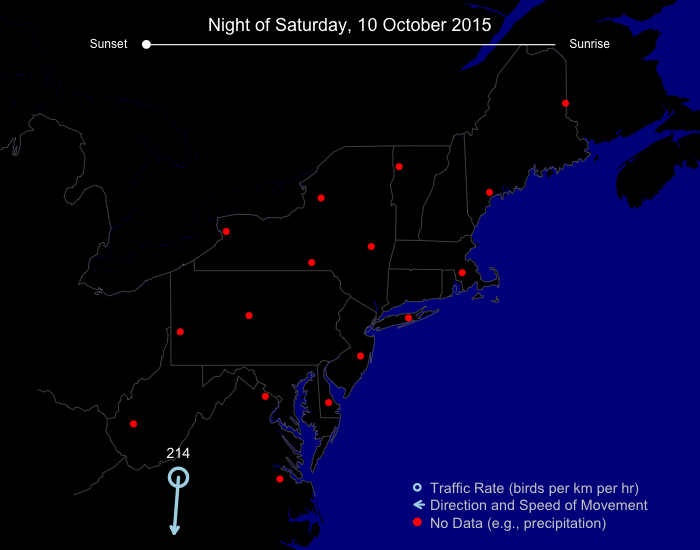
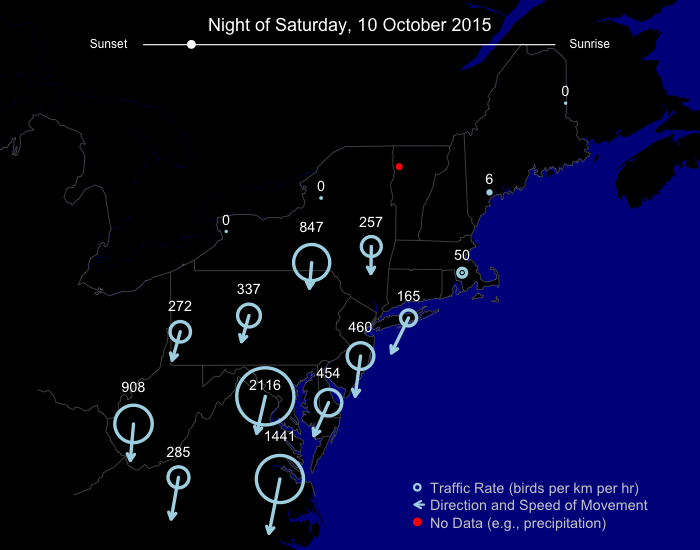
10 October also saw relatively widespread movements, although much less intense, and focused on the southern part of the region.

For more detailed accounting of what species were migrating during this period, please visit our regional migration analysis for the Upper Midwest and Northeast in which we (as humans not just algorithms!) describe and interpret movements in greater detail.