Welcome to our first spring 2016 installment of the traffic report describing northeast US nocturnal bird migration traffic rates, as calculated from a completely automated pipeline of algorithms. The images you see in Traffic Reports present the migration traffic rate (MTR), direction of bird movement, and speed of bird movement. See our first report or scientific paper (currently a preprint) for more information about the calculations and algorithms we use.
Migration over the last weeks
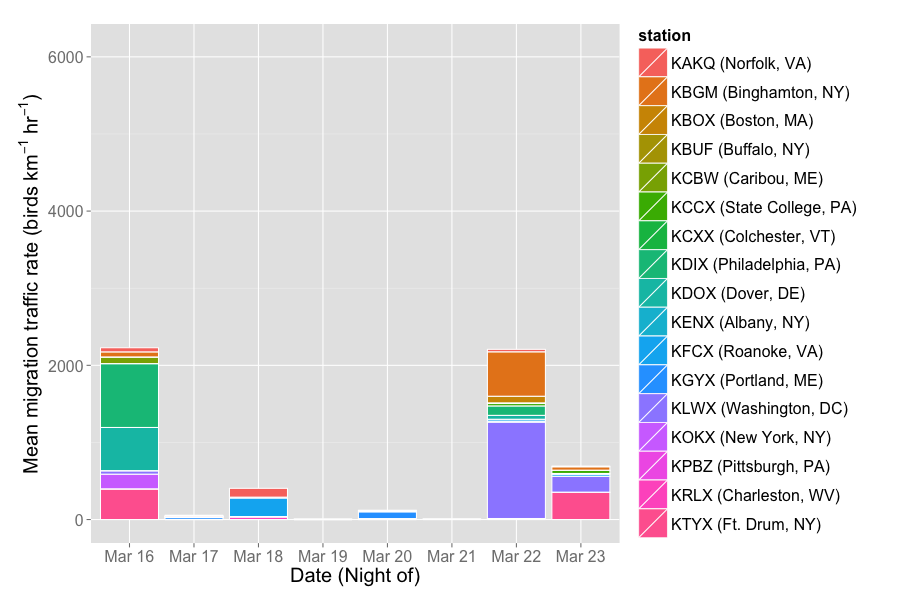
Migration events over the last weeks have been generally small in size, corresponding to light migration, and we have not seen any widespread, monster movements. This is par for the season, anecdotally speaking, as highly variable conditions and strong winter cold fronts can typify March and April. However, such anecdotal characterizations have yet to receive proper treatment in peer-reviewed publication (but see characterizations for autumn). Regardless, remember, migration traffic rate is defined as the number of birds from 0-3,000 meters above radar stations moving hourly over a 1 km line drawn on the ground.
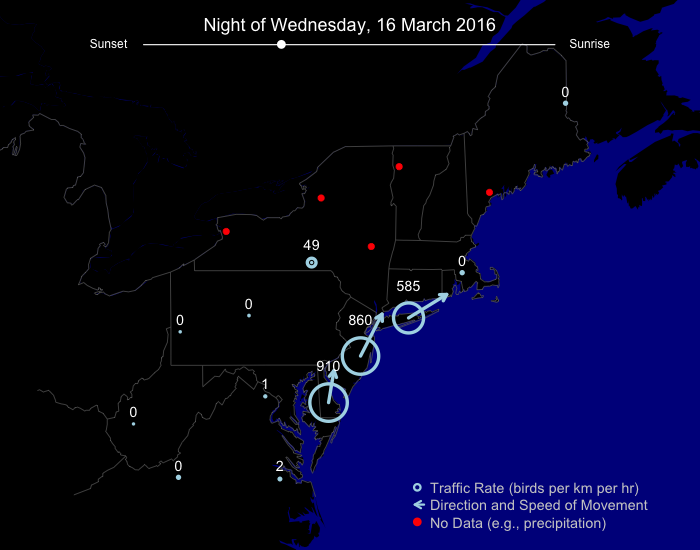
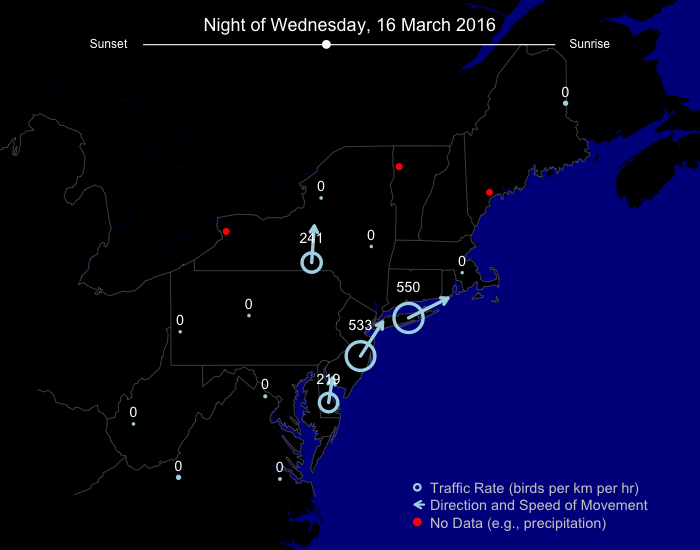
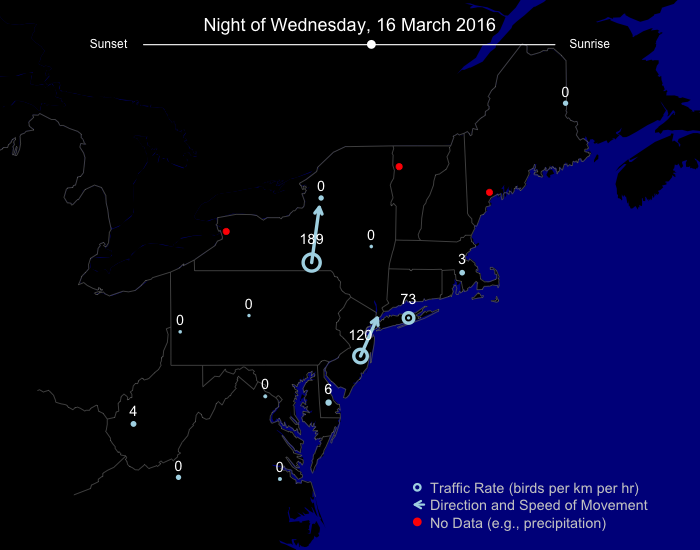
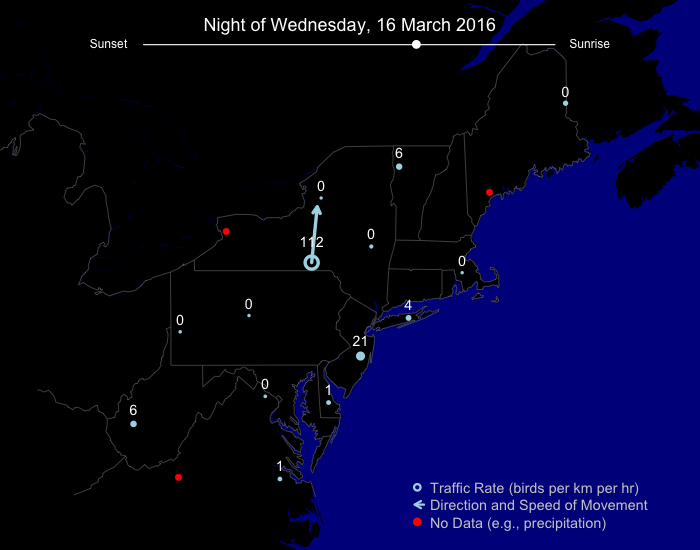
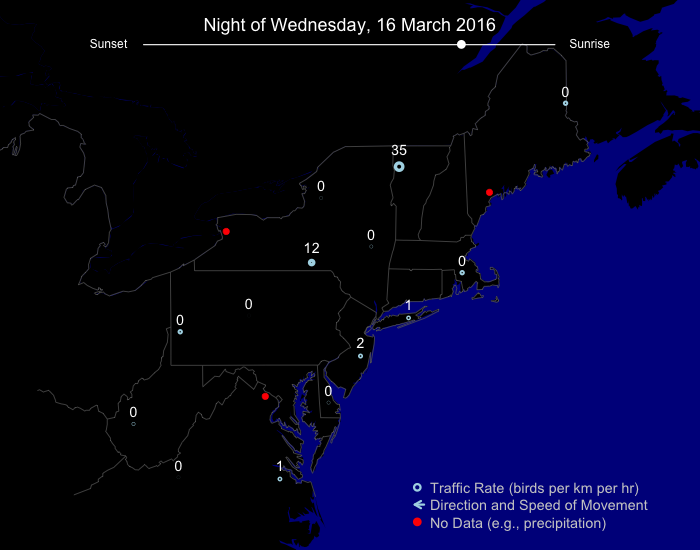
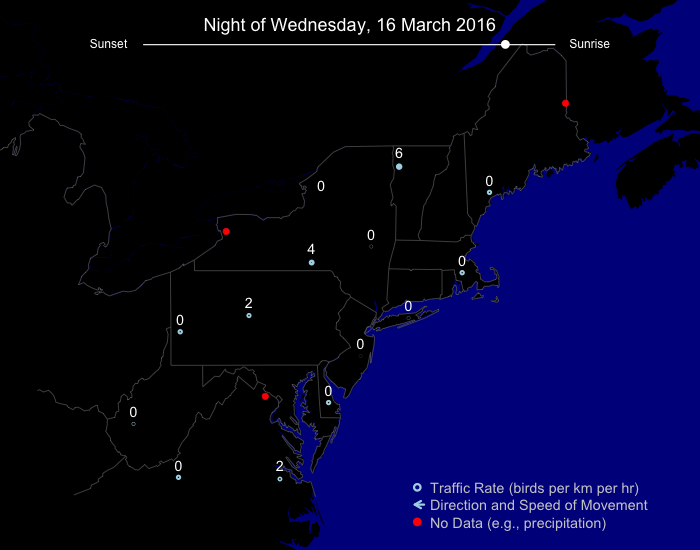
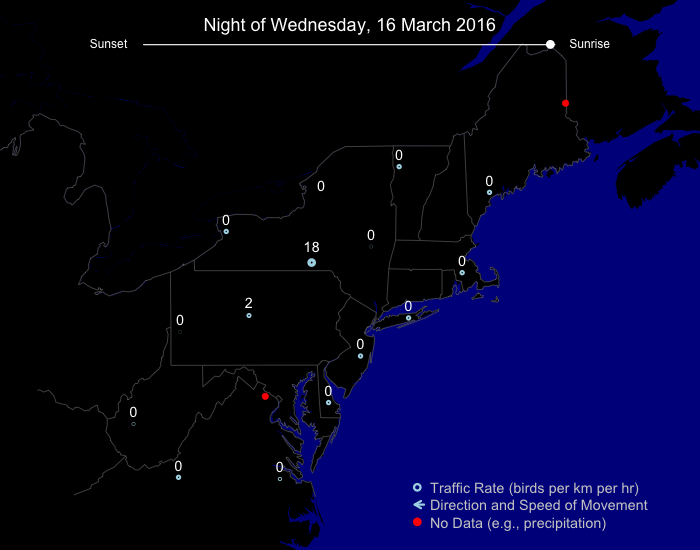
Below we present a summary for 16-23 March, and during this period two nights in particular saw migrants take flight in intensities and to extents beyond simple background noise level scant flights. 16 March movements on radars were primarily distributed in Delaware and New Jersey, whereas more inland flights in Washington, DC and central NY were apparent on 22 March.
Nightly migration loops
March
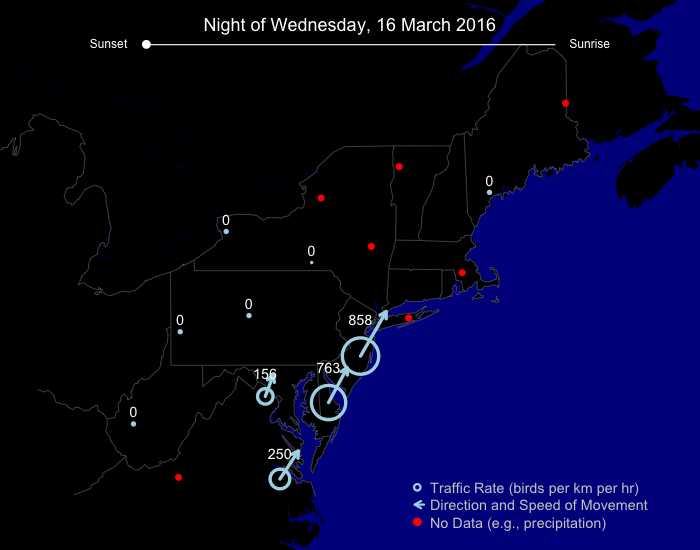
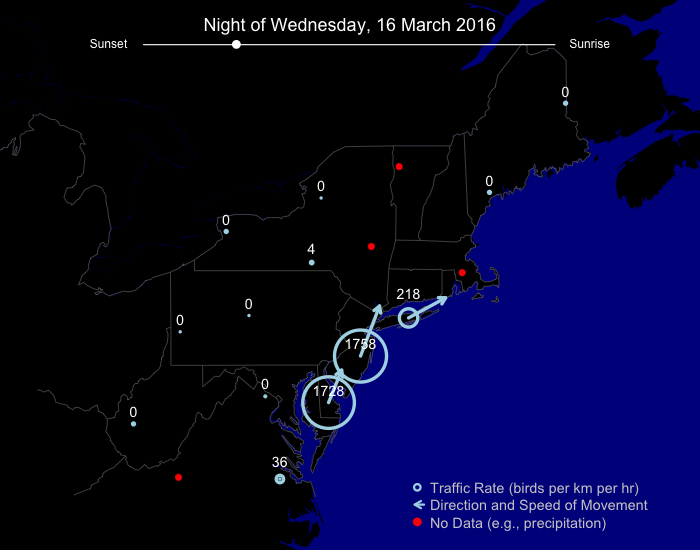
Here we show more detail about the two larger migration nights in the period defined in the aforementioned summary. On 16 March, our model identified light to locally moderate movements that were mostly restricted to the mid Atlantic states north through southeastern NY.
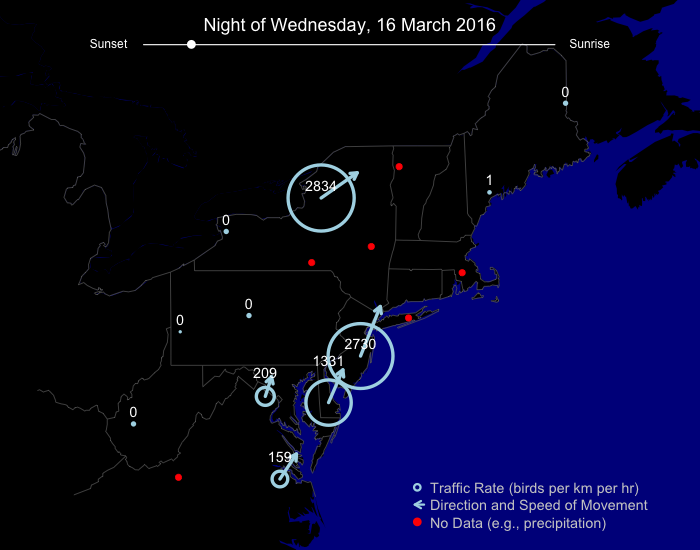
In contrast, 22 March imagery shows the different, more inland flavor to the movements (although some coastal movement in New Jersey is still apparent).
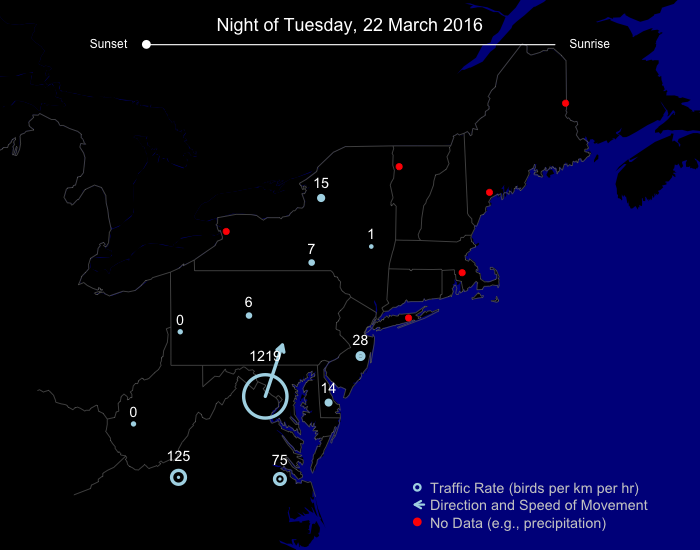
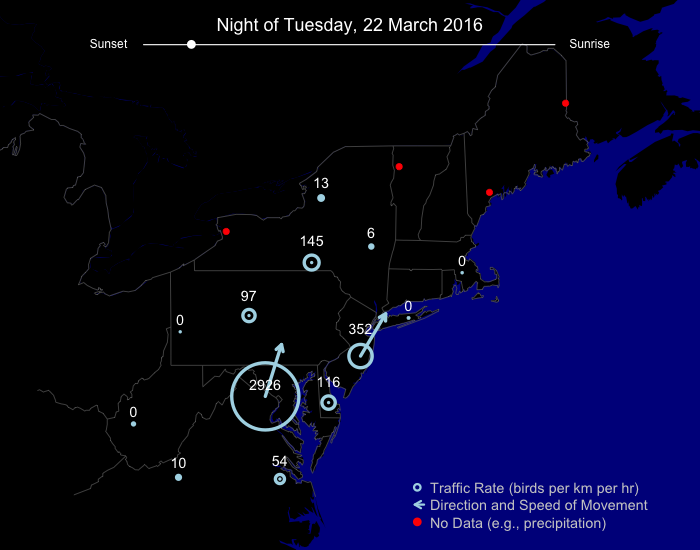
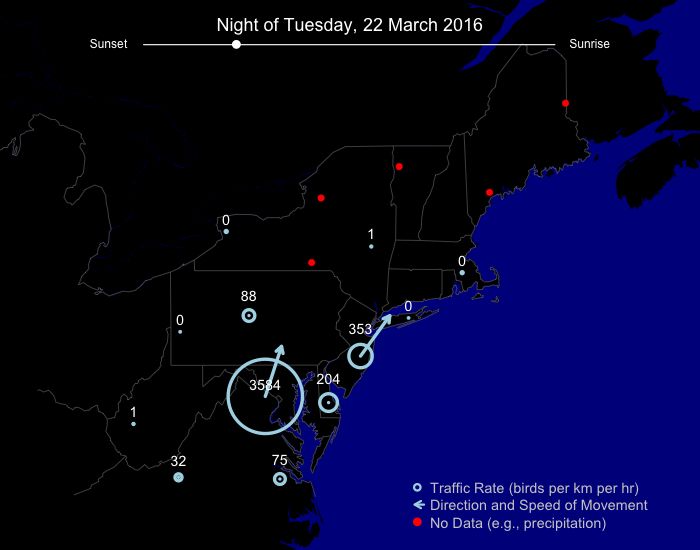
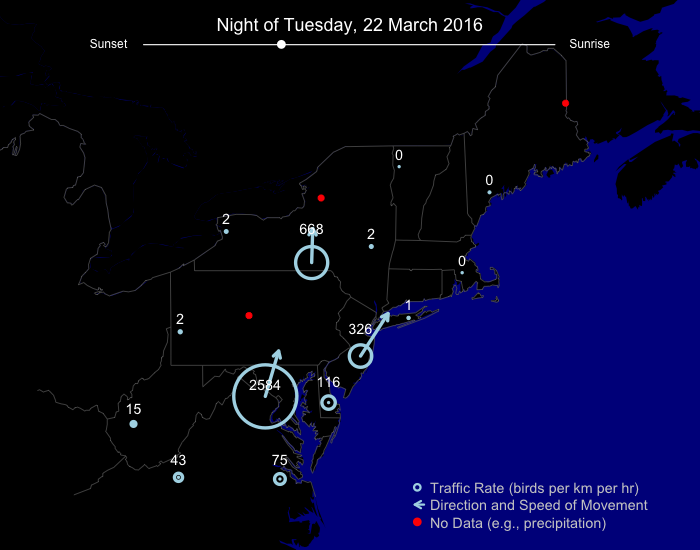
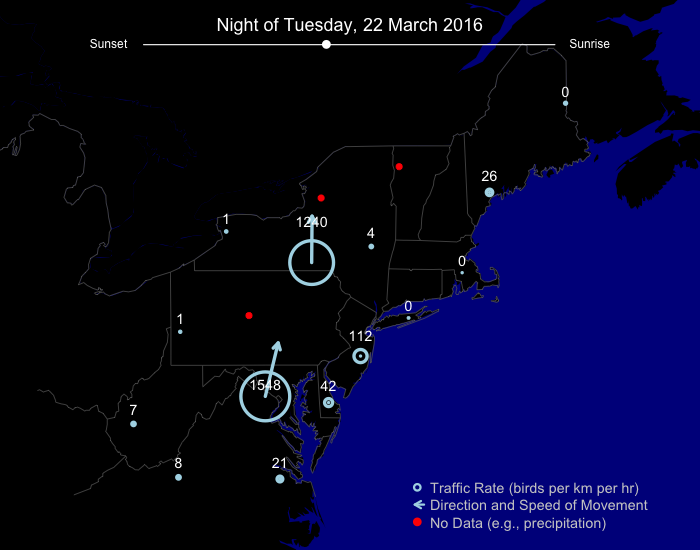
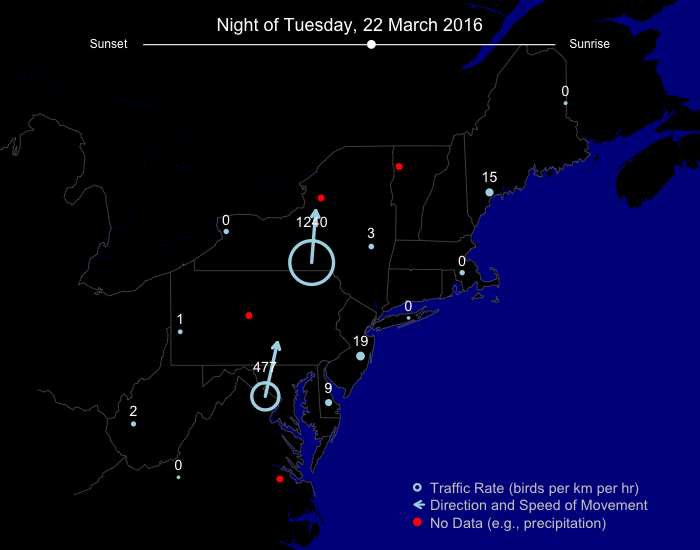
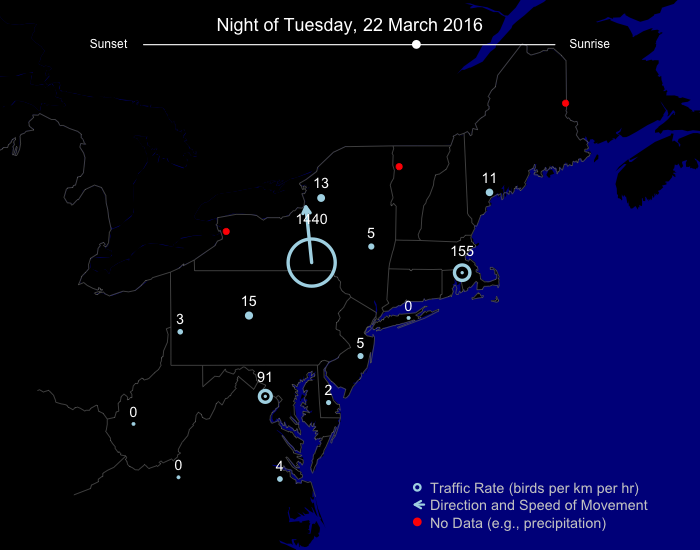
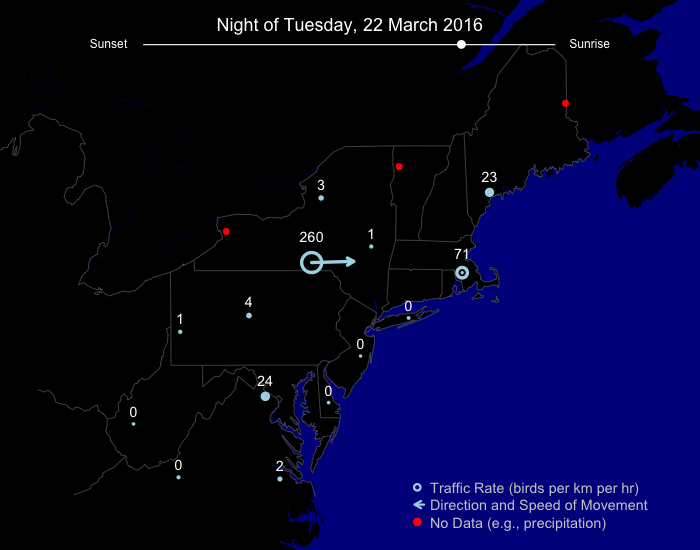
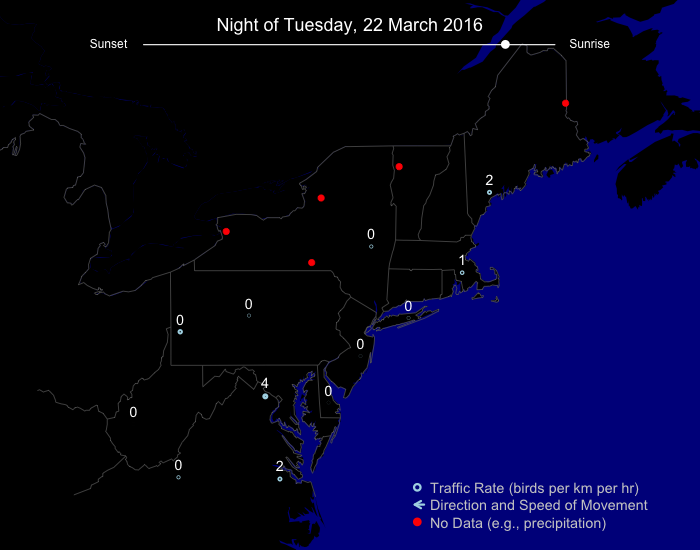
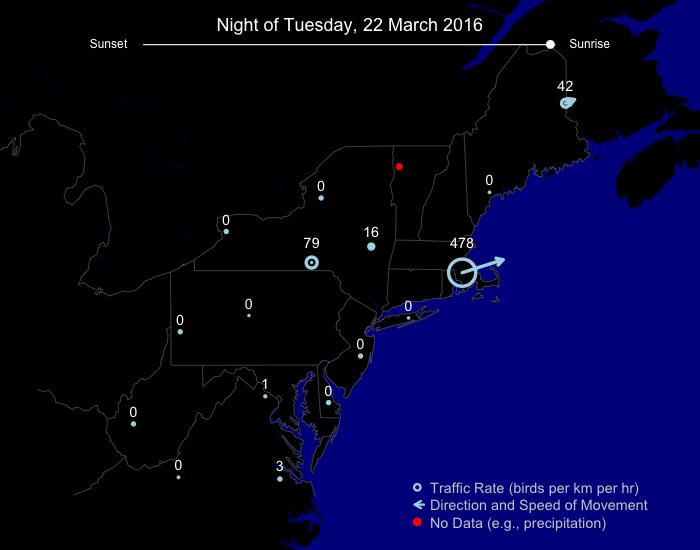
Remember in both of these cases, our model is not perfect, and some of these detections may be erroneous classifications of precipitation as birds.
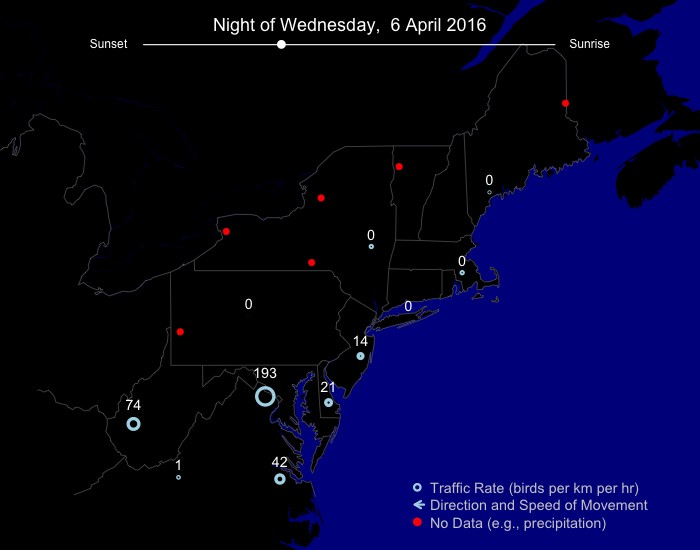
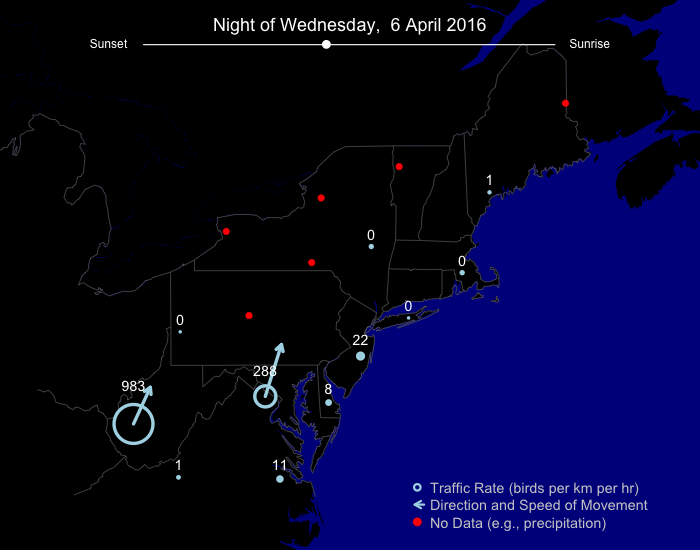
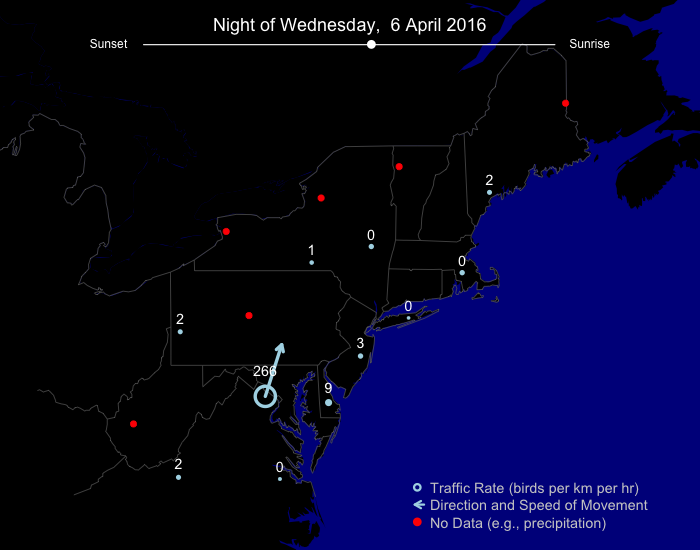
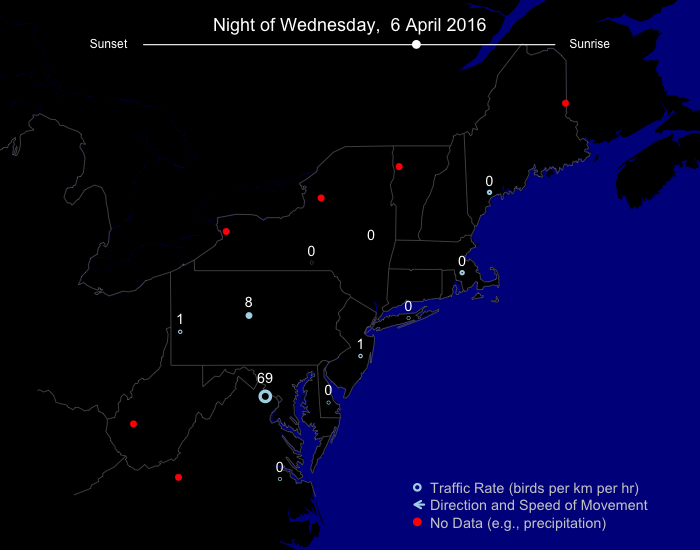
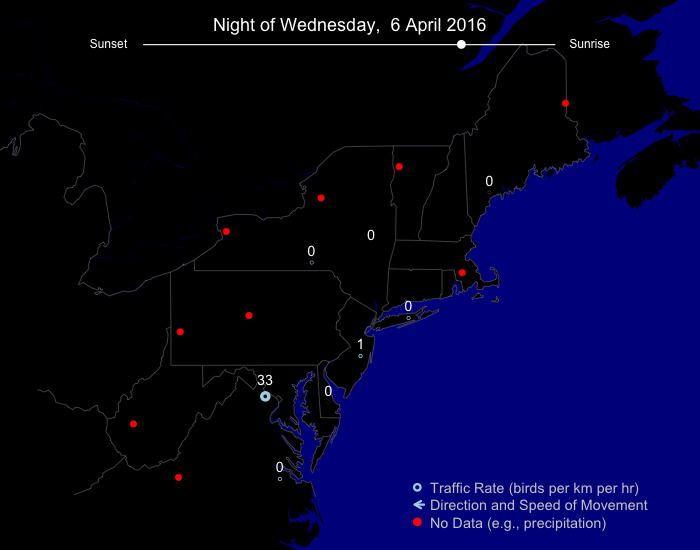
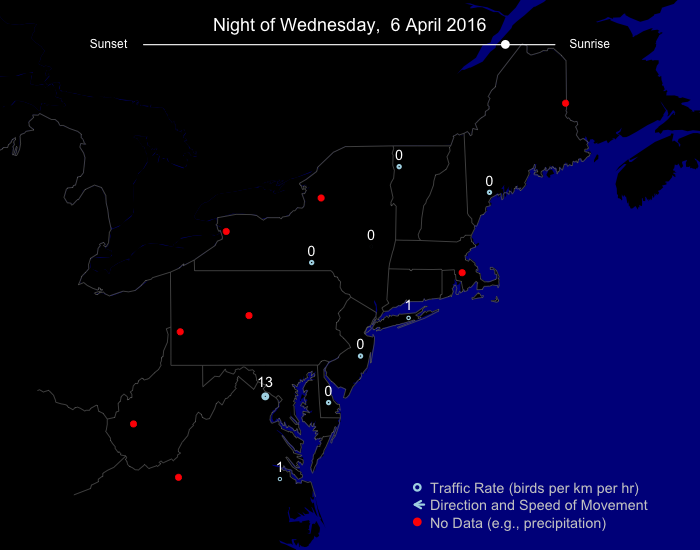
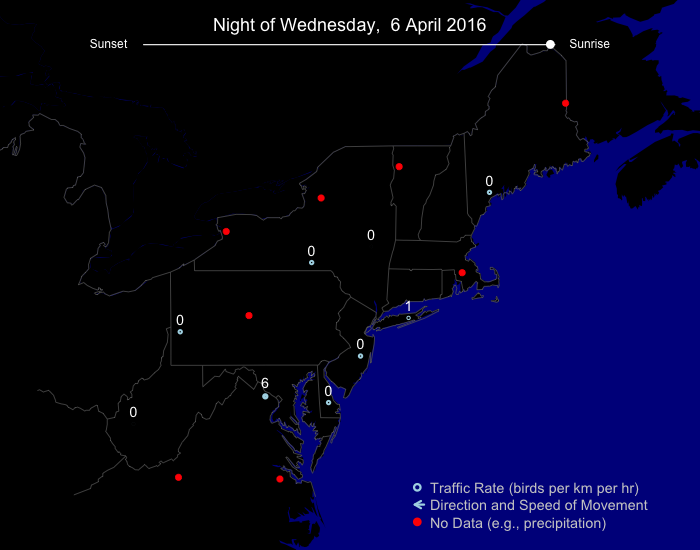
April
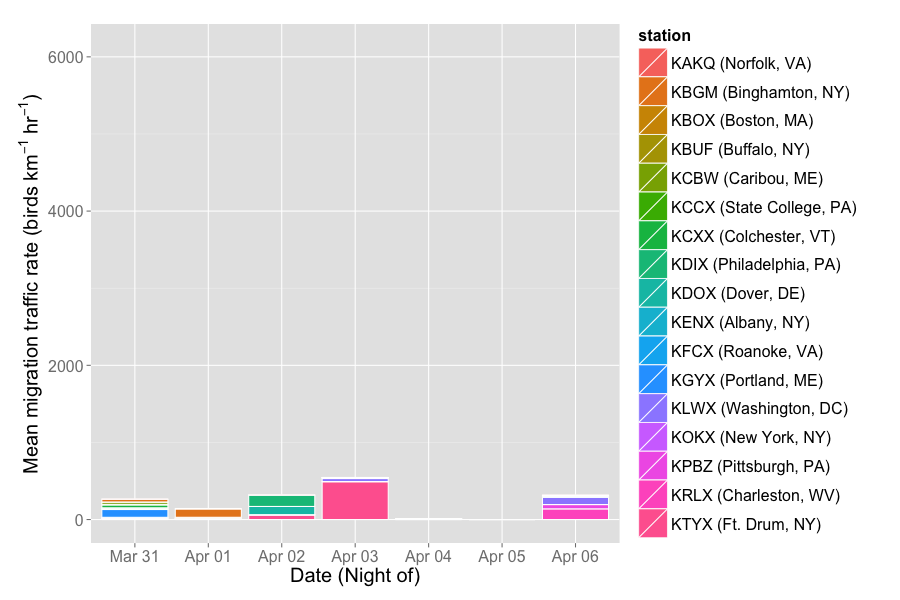
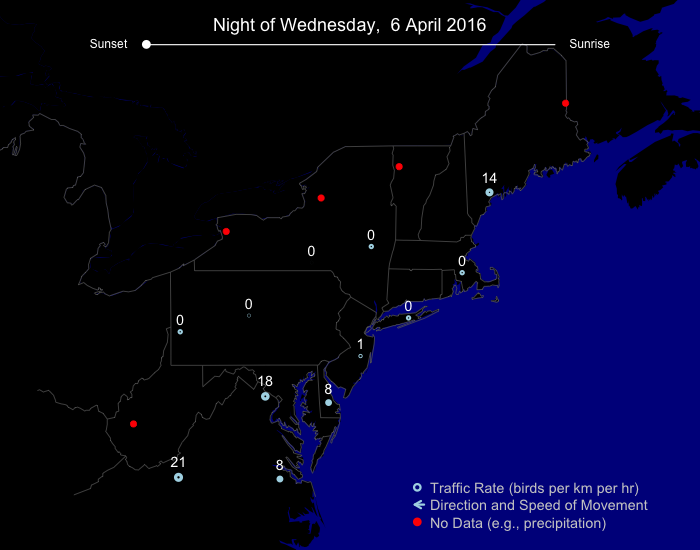
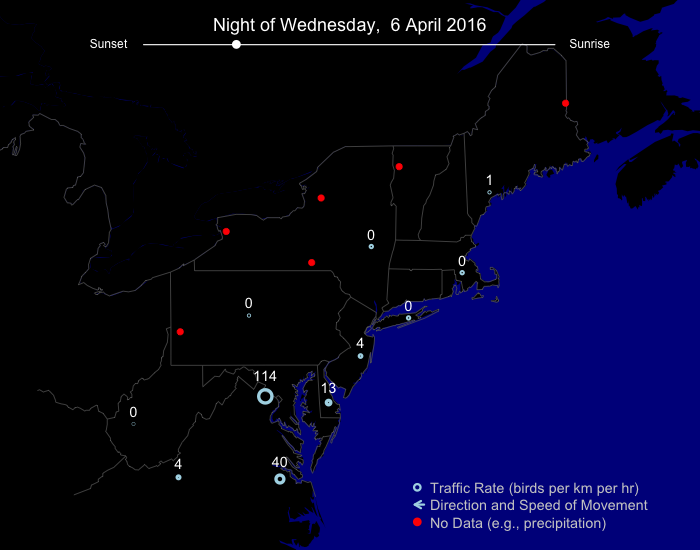
April has seen an unseasonable blast of cool in the region, most probably a function of the dreaded polar vortex. Lackluster movements have characterized the migration scene, as depicted in the graphic that follows. 6 April was a “highlight” here, so to speak, but migration was light at best across the region with only two more southerly radar stations responsible for most of the action (KTYX).

For more detailed accounting of what species were migrating during this period, please visit our regional migration analyses (here, here and here) for the Upper Midwest and Northeast in which we (as humans not just algorithms!) describe and interpret movements in greater detail.