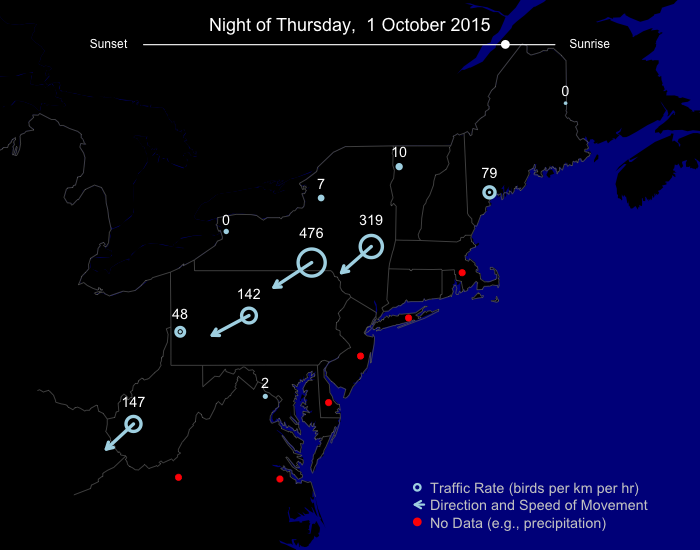
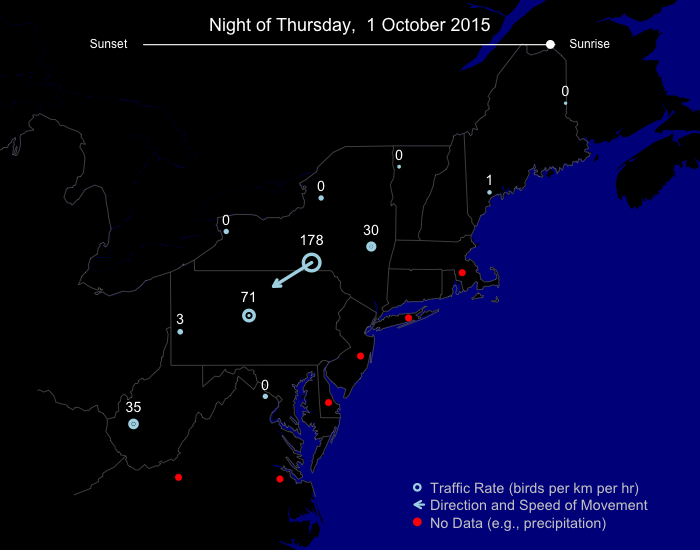
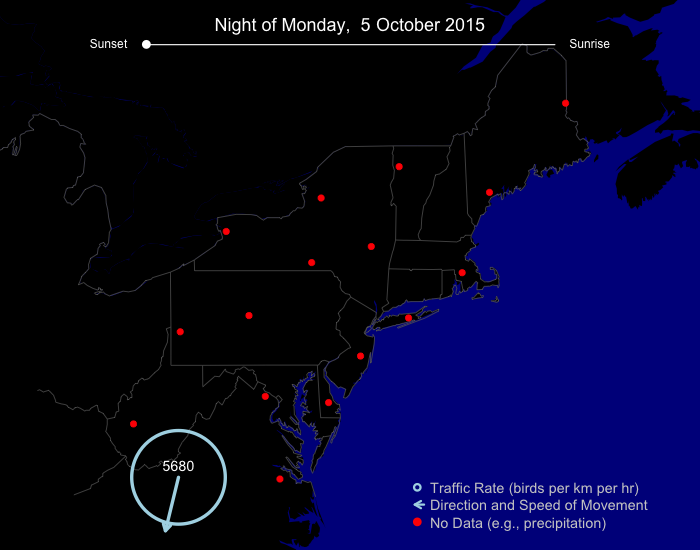
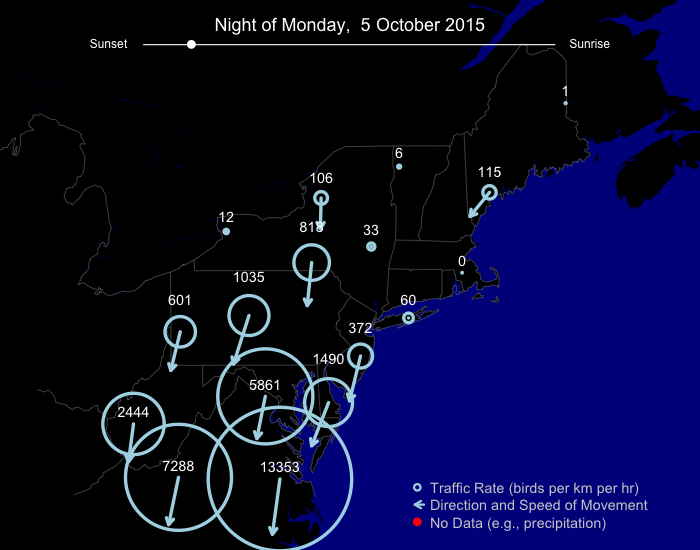
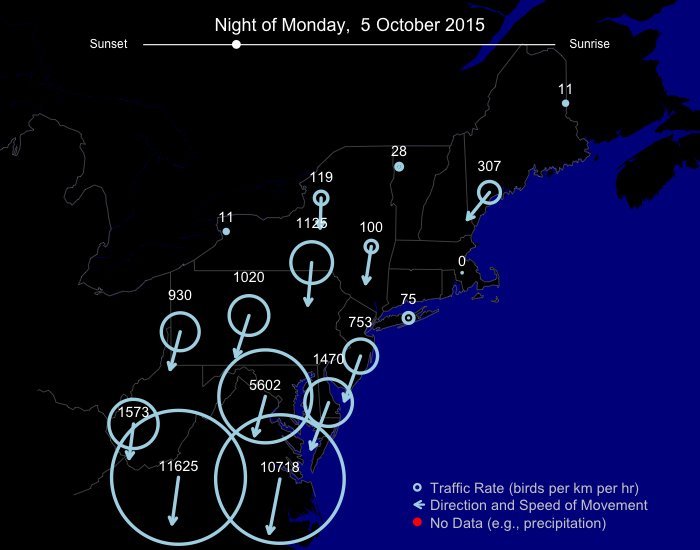
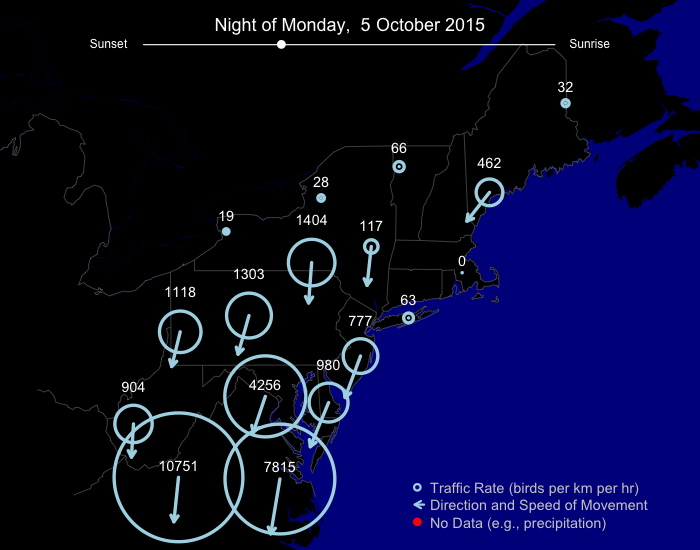
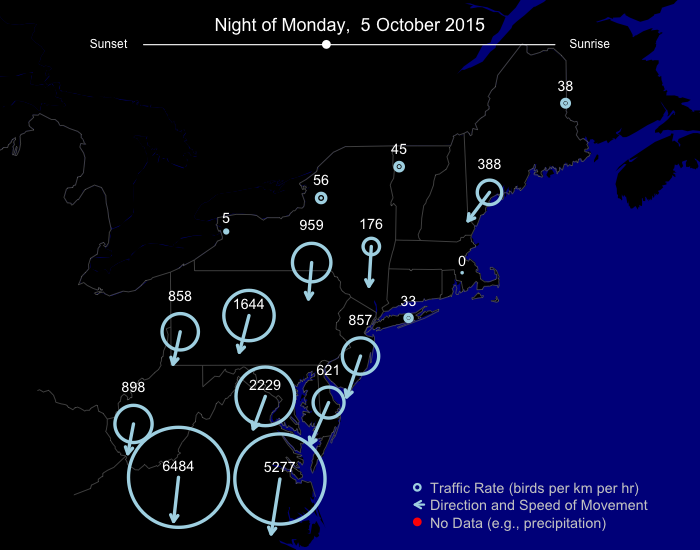
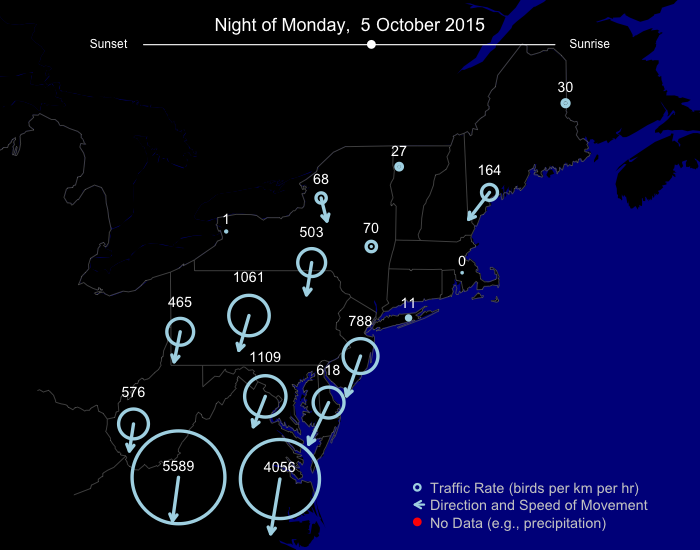
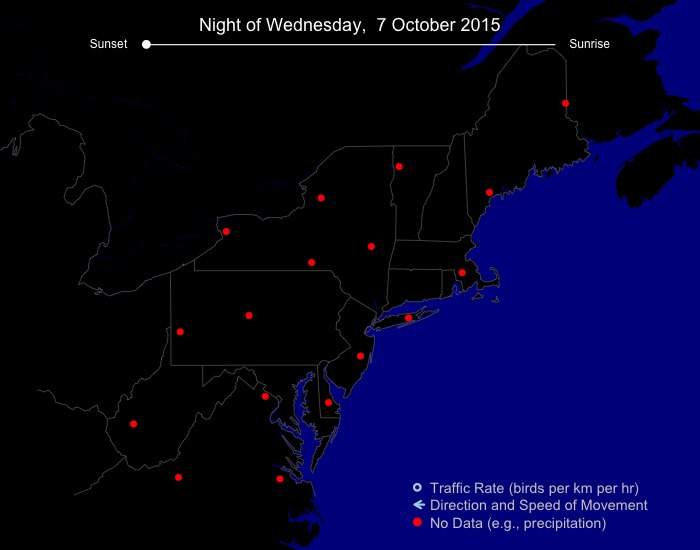
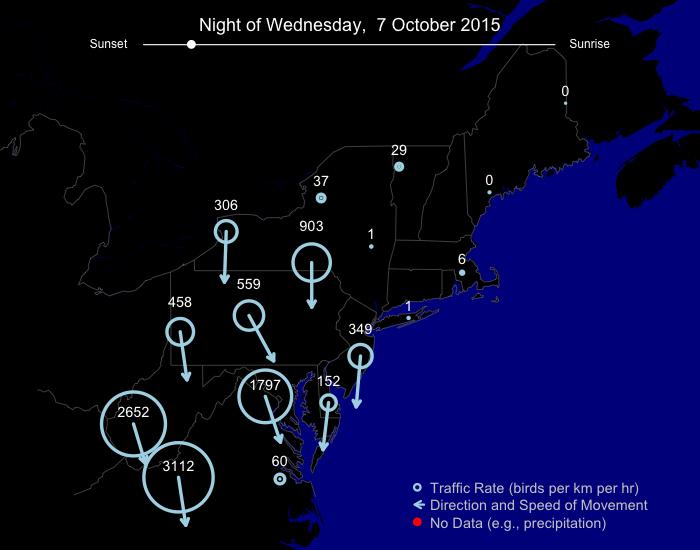
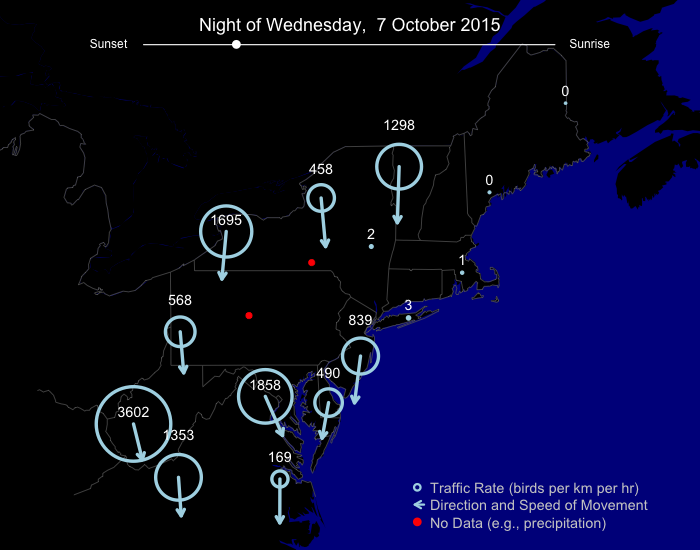
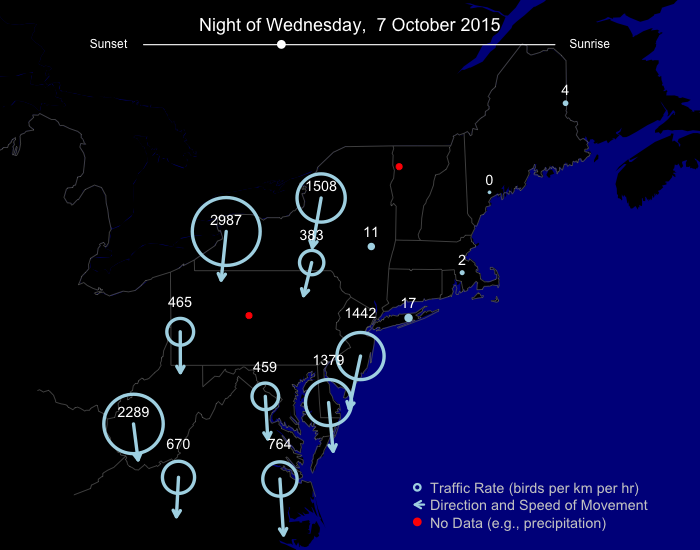
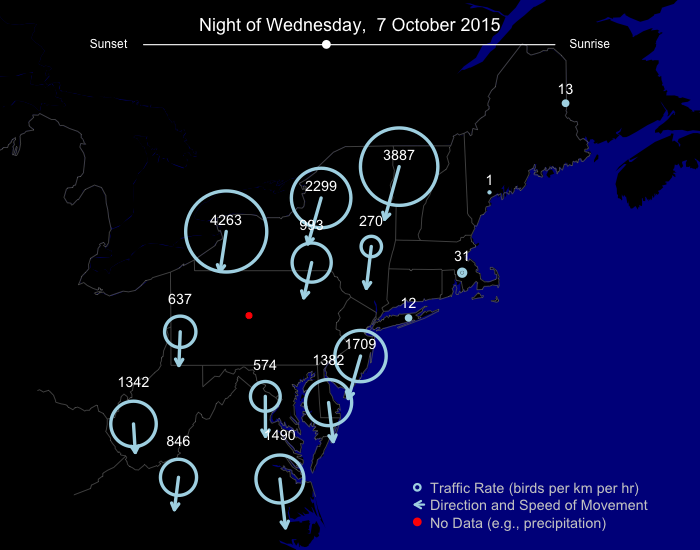
Welcome to our latest installment of the traffic report describing northeast US nocturnal bird migration traffic rates, as calculated from a completely automated pipeline of algorithms. The images you see in Traffic Reports present the migration traffic rate (MTR), direction of bird movement, and speed of bird movement. See our first report or scientific paper (currently a preprint) for more information about the calculations and algorithms we use.
Migration over the last week
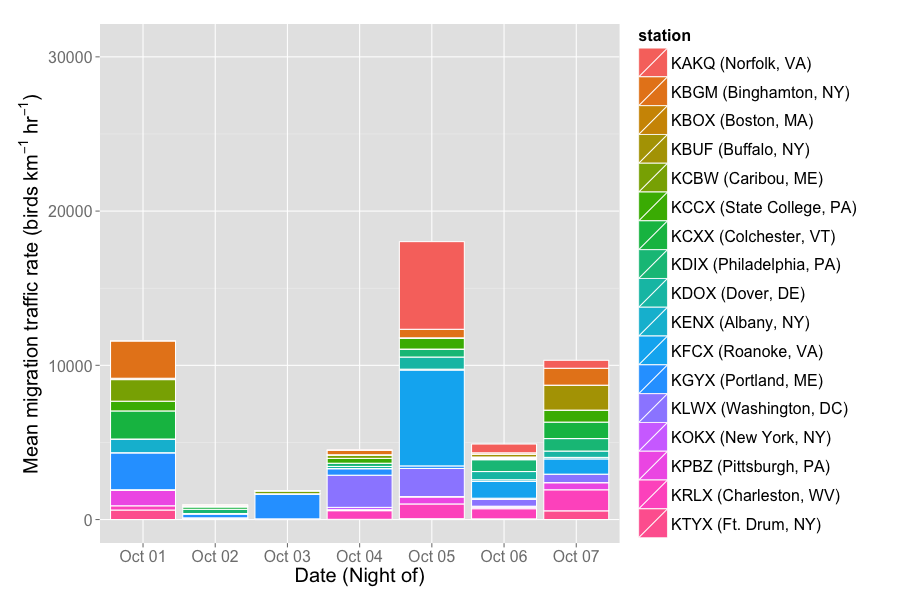
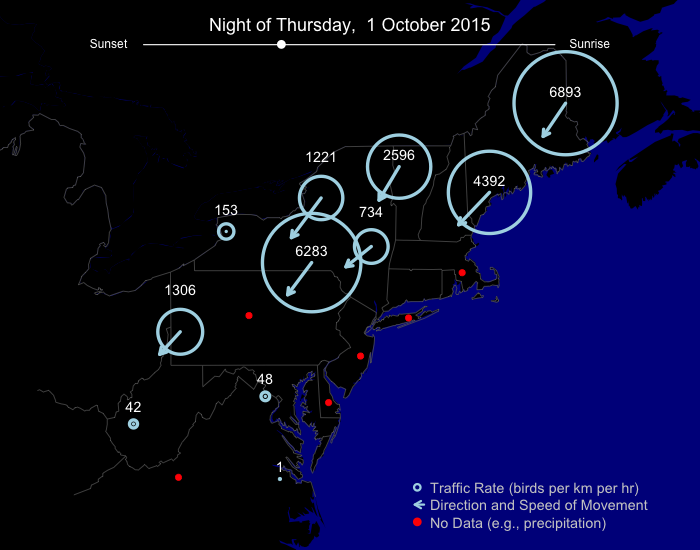
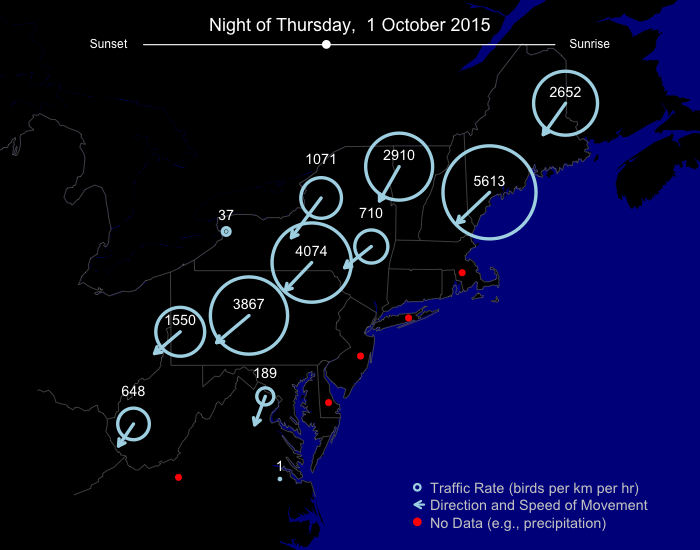
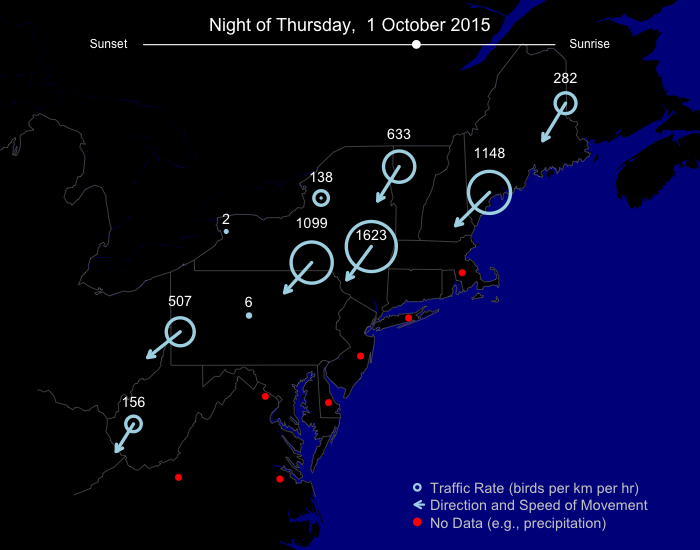
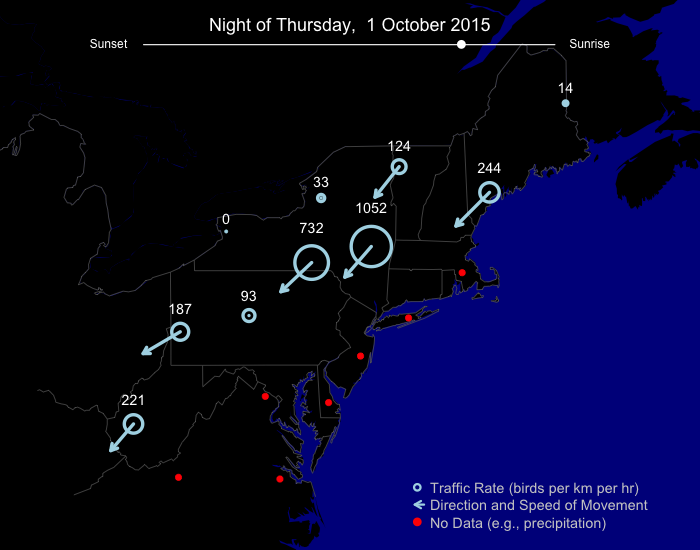
Migration events over the last week were respectable in size, but we did not see the widespread, monster movements that often grace this time of season. For example, in our paper characterizing nocturnal movements in the northeastern US, the largest movements we reported occurred during the first week of October. Remember, migration traffic rate is defined as the number of birds from 0-3,000 meters above radar stations moving hourly over a 1 km line drawn on the ground.
Nightly migration loops
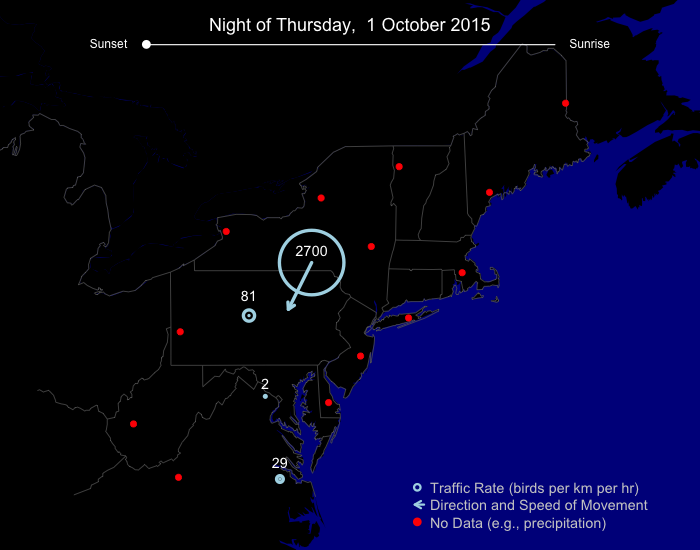
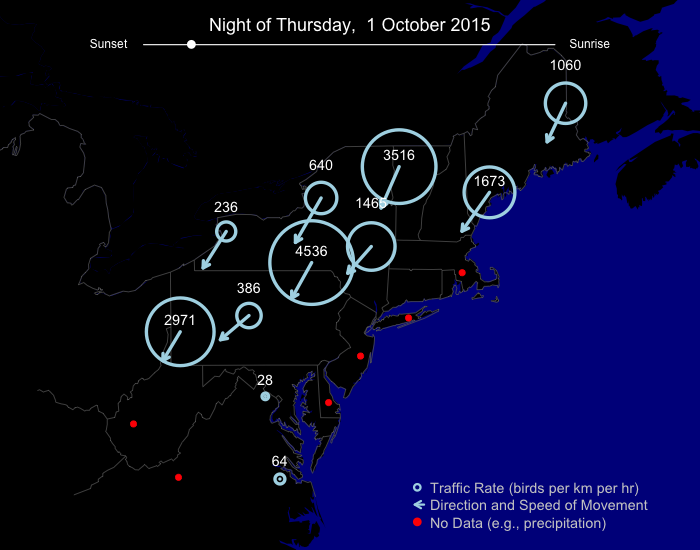
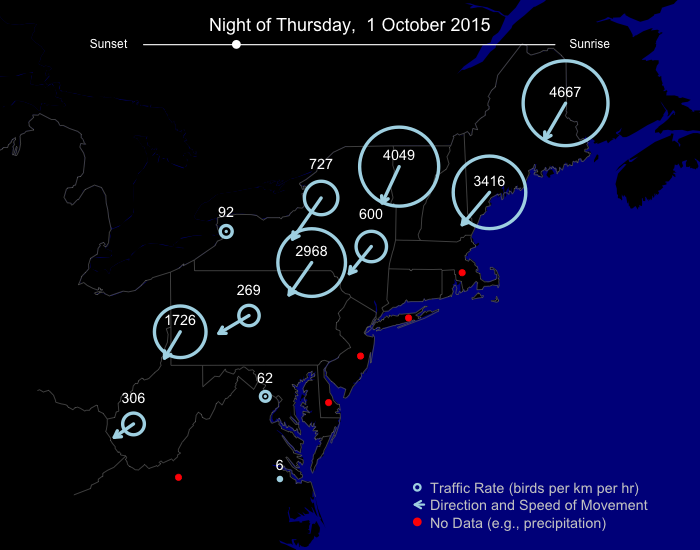
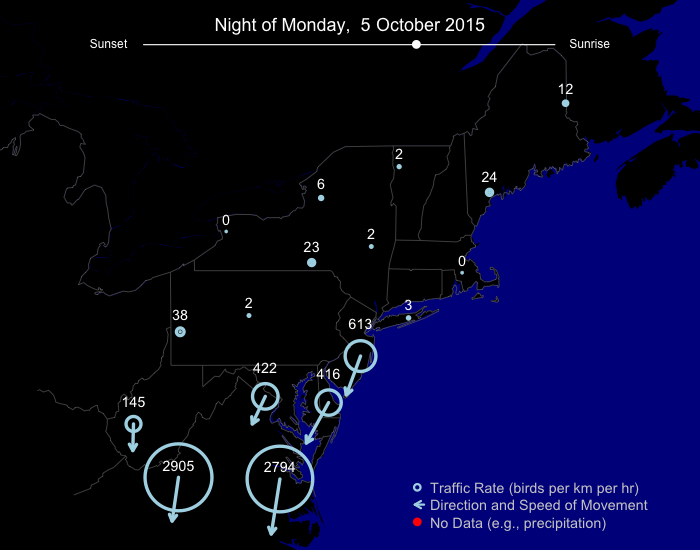
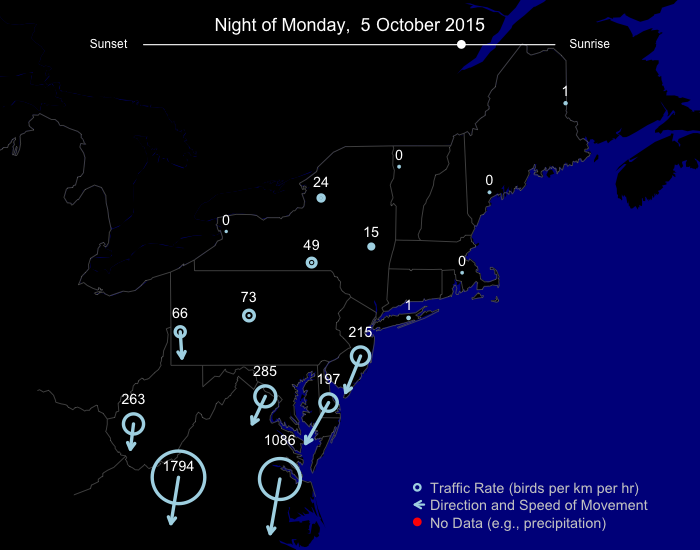
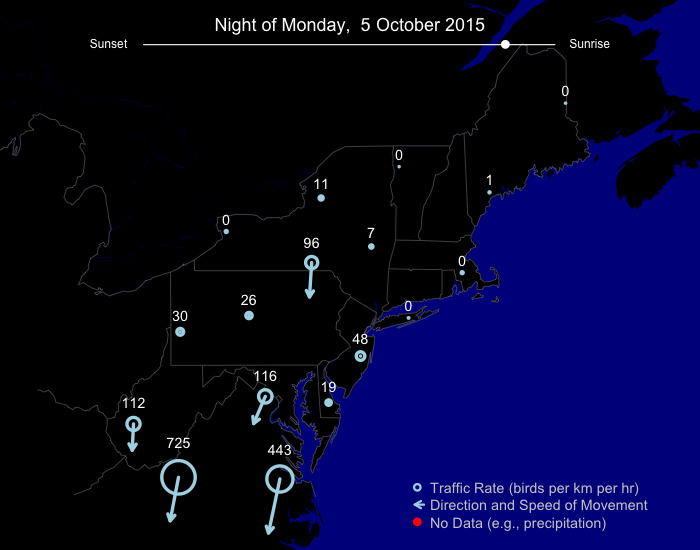
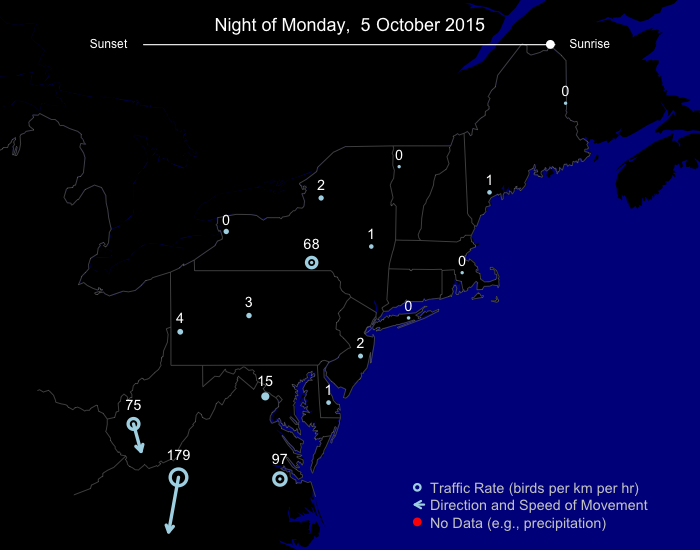
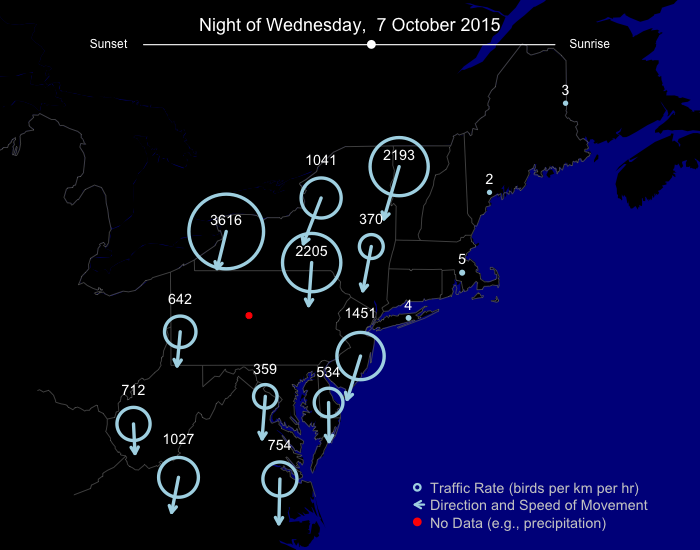
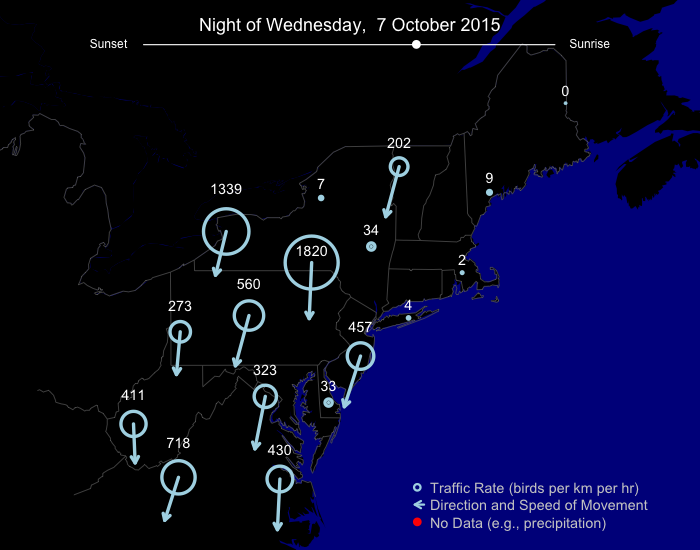
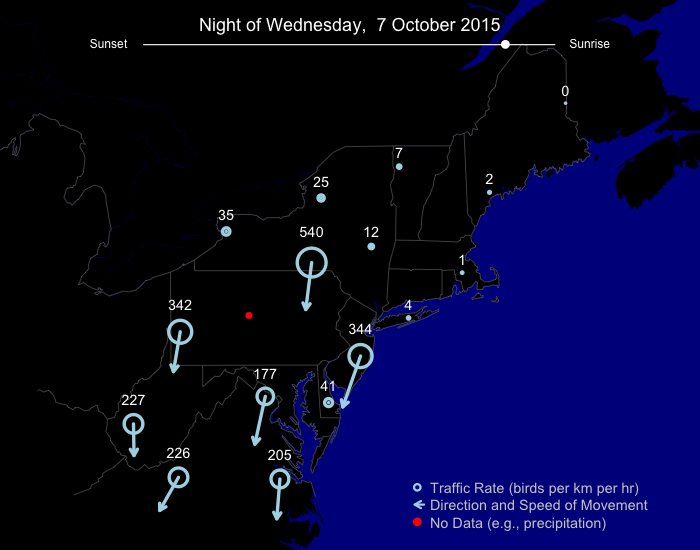
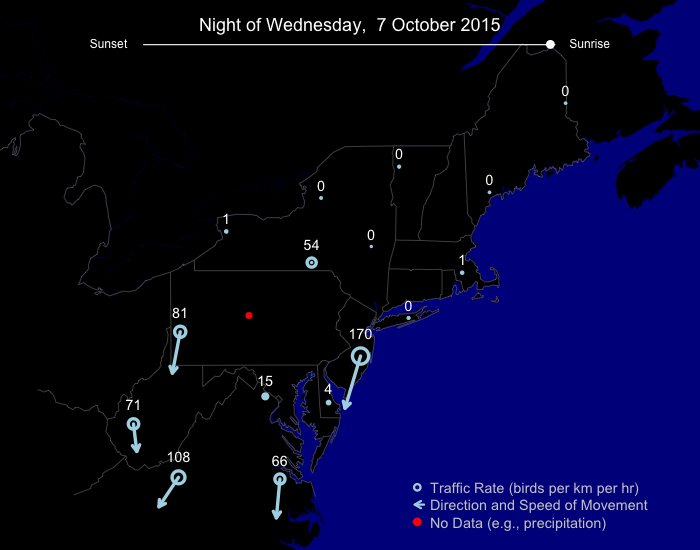
The three biggest nights were 1, 5, and 7 October. On October 1st, movement was generally quite heavy in inland areas; coastal areas experienced rain.

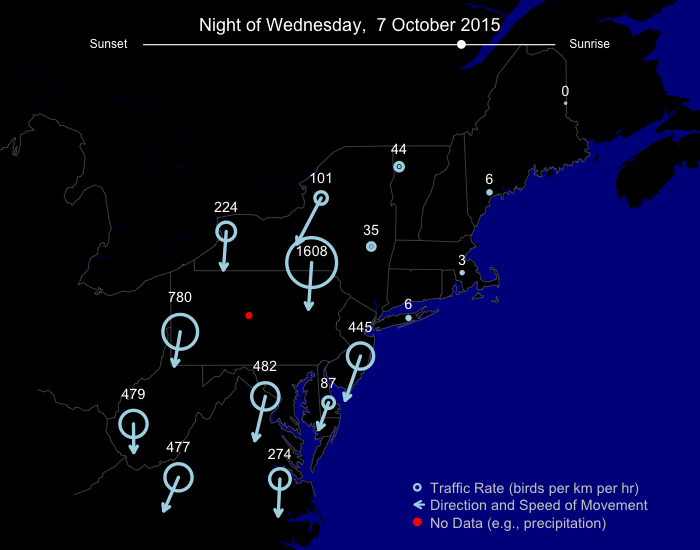
On 5 October, after three nights of lackluster conditions, migration was moderate at most locations, but extremely heavy in the far south of the region.
Most recently, 7 October saw widespread moderate to heavy movements.
For more detailed accounting of what species were migrating during this period, please visit our regional migration analysis for the Upper Midwest and Northeast in which we (as humans not just algorithms!) describe and interpret movements in greater detail.