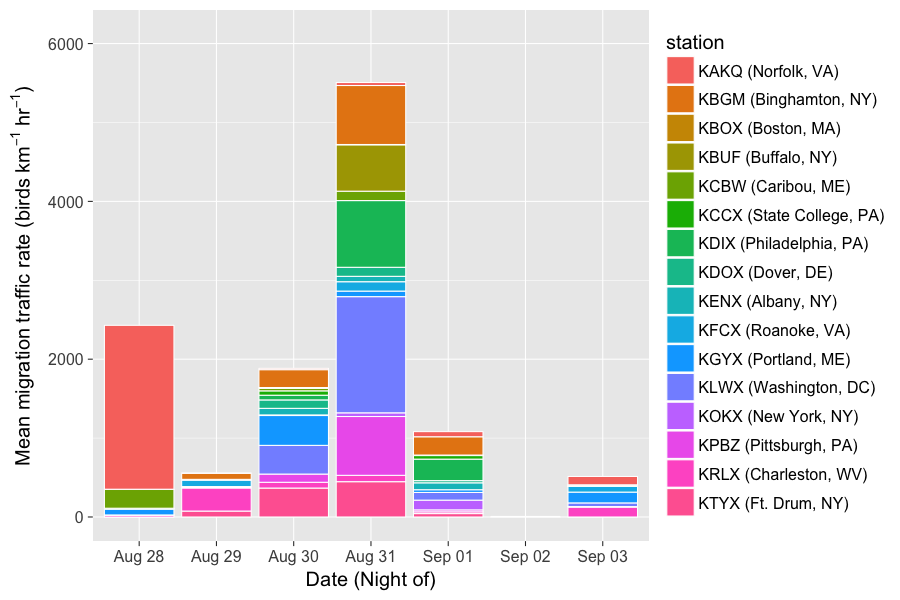
Welcome to our first fall 2017 installment of the traffic report describing northeast US nocturnal bird migration traffic rates, as calculated from a completely automated pipeline of algorithms. The images you see in Traffic Reports present the migration traffic rate (MTR), direction of bird movement, and speed of bird movement. See our first report or scientific paper for more information about the calculations and algorithms we use. Remember, migration traffic rate is defined as the number of birds from 0-3,000 meters above radar stations moving hourly over a 1 km line drawn on the ground.

Above we see the contributions of the Northeastern US radars to migration traffic on the nights from 29 August to 3 September 2017. Note the night of 31 August, when significant bird migration occurred across the region, particularly from stations in the southern and western portions of the region. Let’s take a closer look at this night below:
Nightly migration loops
31 August
Here we show more detail about a large migration night in the period defined in the aforementioned summary. On 31 August 2017 our model identified a moderate to heavy flight of migrants across the region. Below, we see a large pulse of birds in central and western New York just after sunset, followed by significant exodus along the Appalachians and in the mid Atlantic region. Toward sunrise most of the movements are in the DelMarVa region and southern reaches of the radars in our sample. Note also the movements far to the northeast of the region, in Maine, early in the evening.
We like to check the model every now and again to see whether it is behaving as expected. In this case, when we consider the actual radar data as seen below, without removing non biological targets (like precipitation) or attempting to remove non bird biological targets (like insects and bats), we see that the model appears to do a respectable job in the modeled portion of the Upper Midwest and Northeast region. The distribution of birds and their intensities aligns well with what our model highlighted as bird migration, in particular to the south and west of the region in the first half of the night and then in the southern reaches of the region closer to sunrise.
For more detailed accounting of what species were migrating during this period, please visit our regional migration analyses for the Upper Midwest and Northeast in this week’s post in which we (as humans not just algorithms!) describe and interpret movements in greater detail.


