Welcome to our latest installment of the traffic report describing northeast US nocturnal bird migration traffic rates, as calculated from a completely automated pipeline of algorithms. The images you see in Traffic Reports present the migration traffic rate (MTR), direction of bird movement, and speed of bird movement. See our first report or scientific paper (currently a preprint) for more information about the calculations and algorithms we use.
Migration over the last week
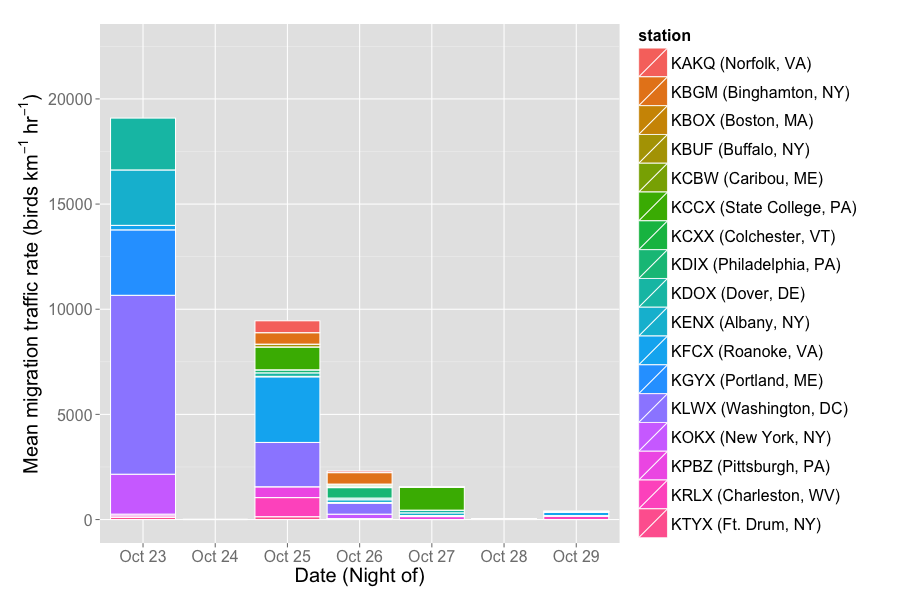
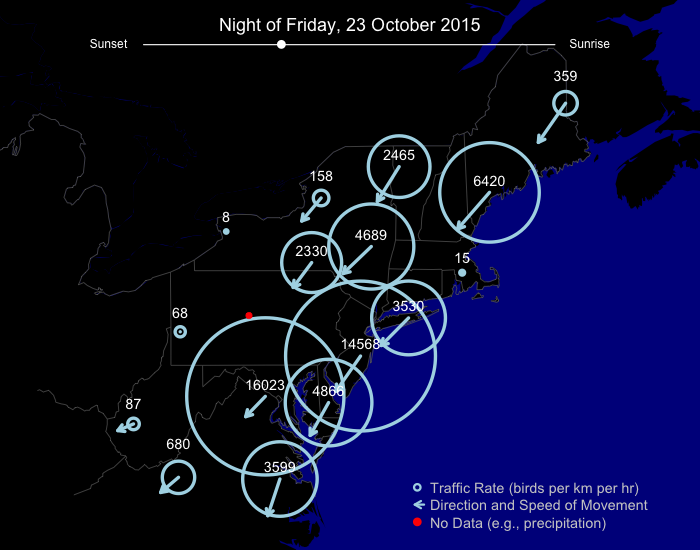
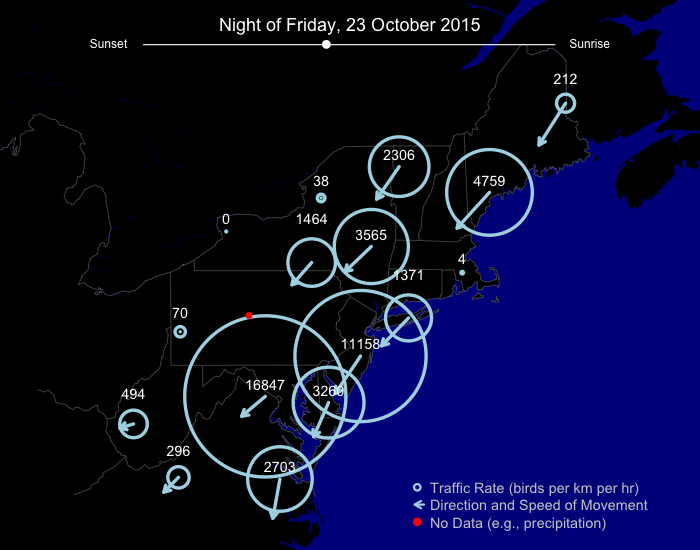
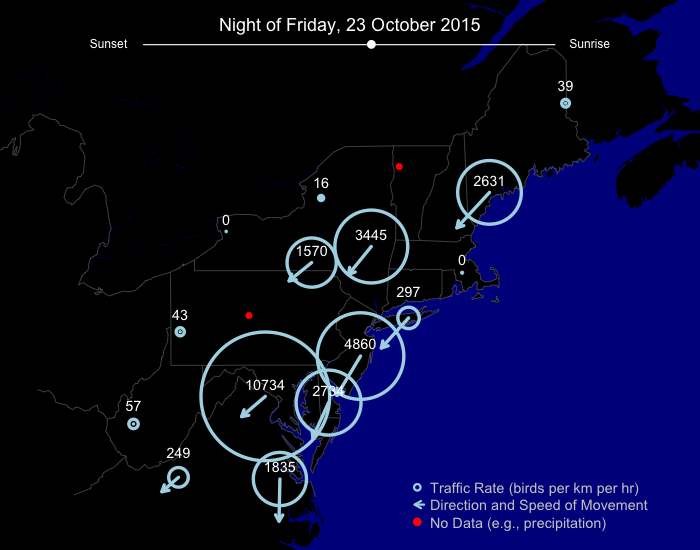
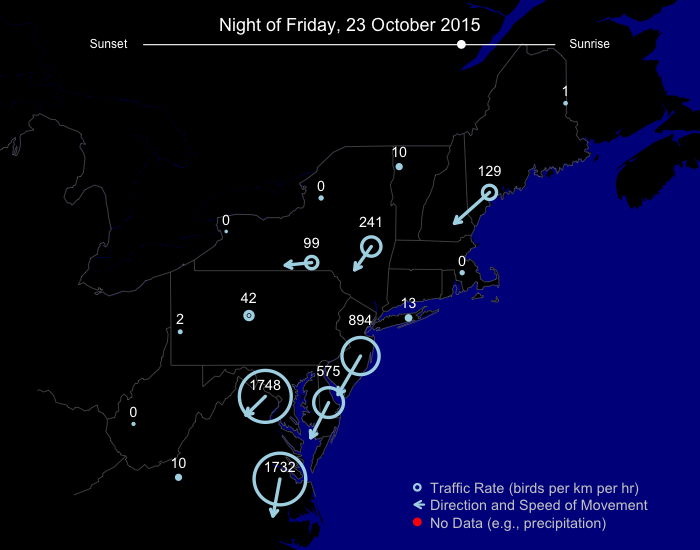
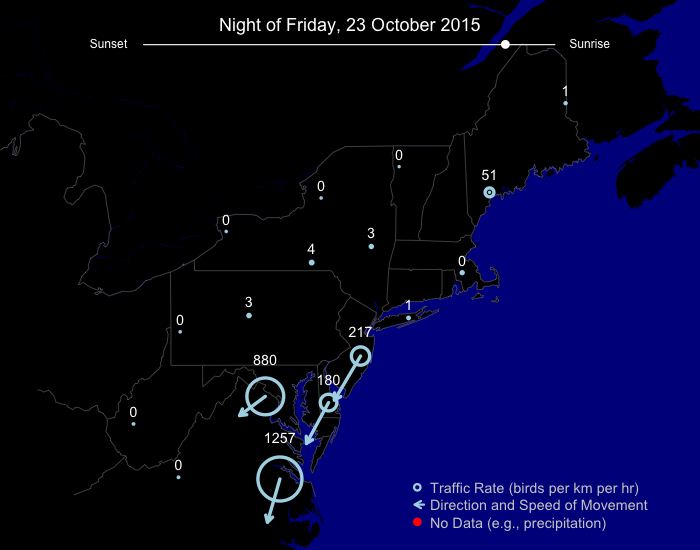
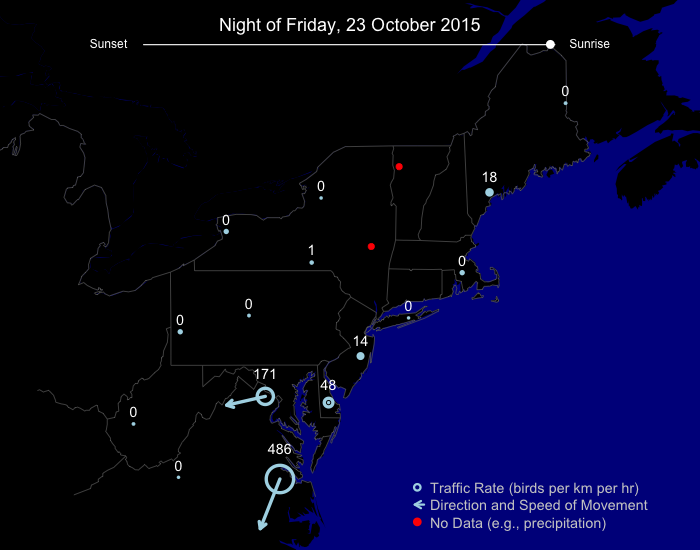
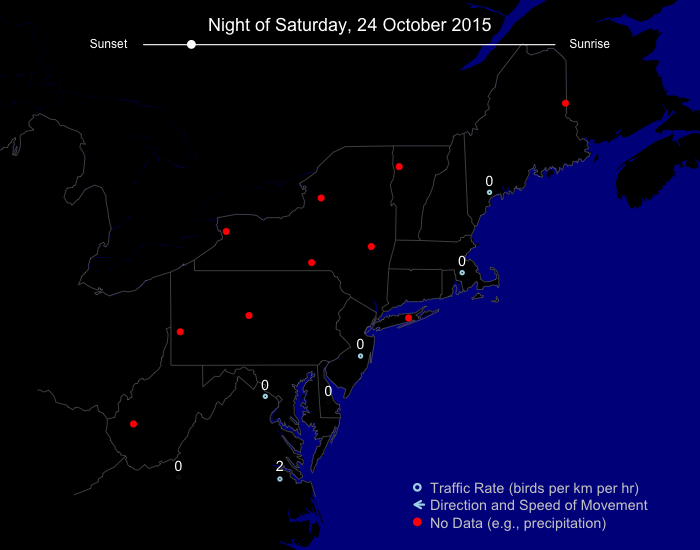
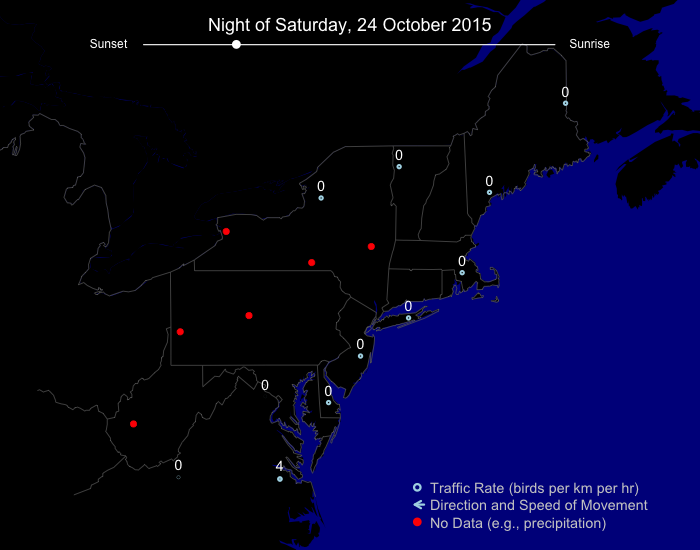
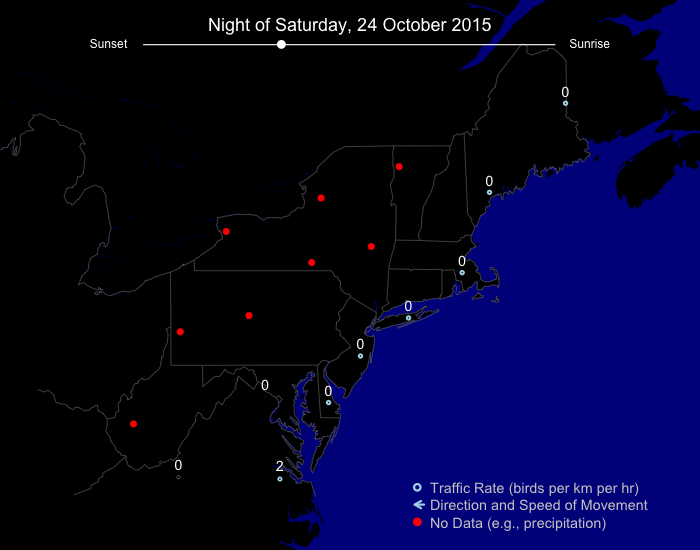
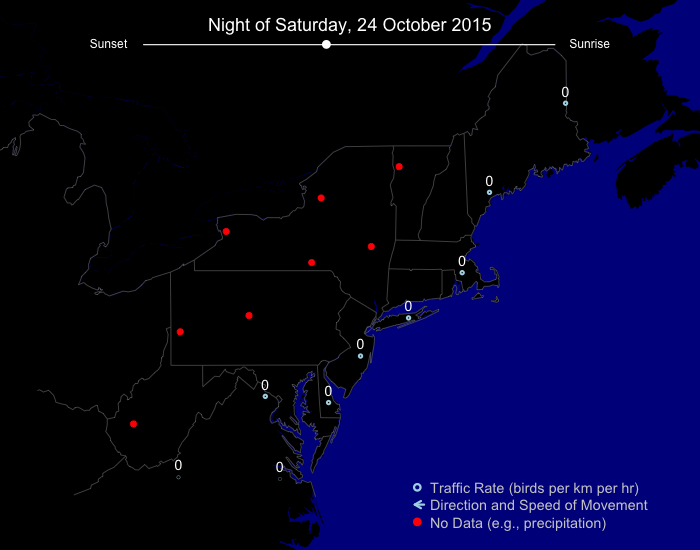
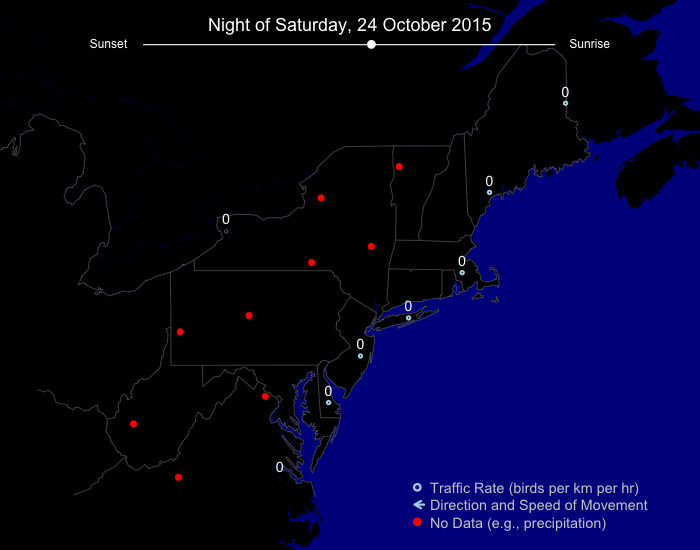
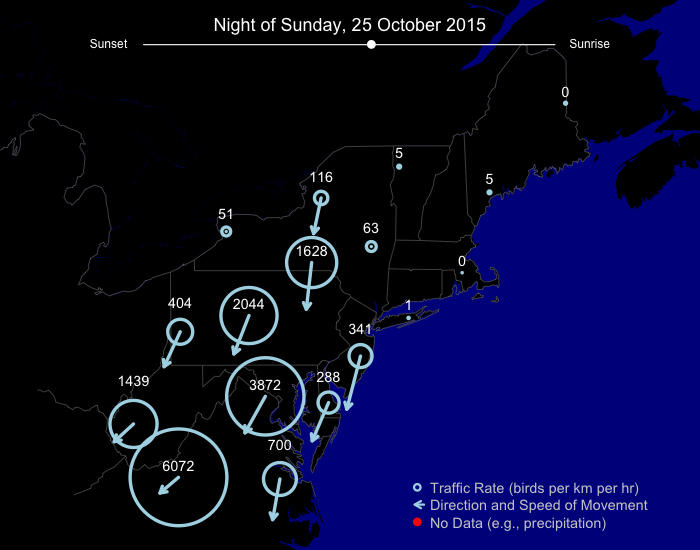
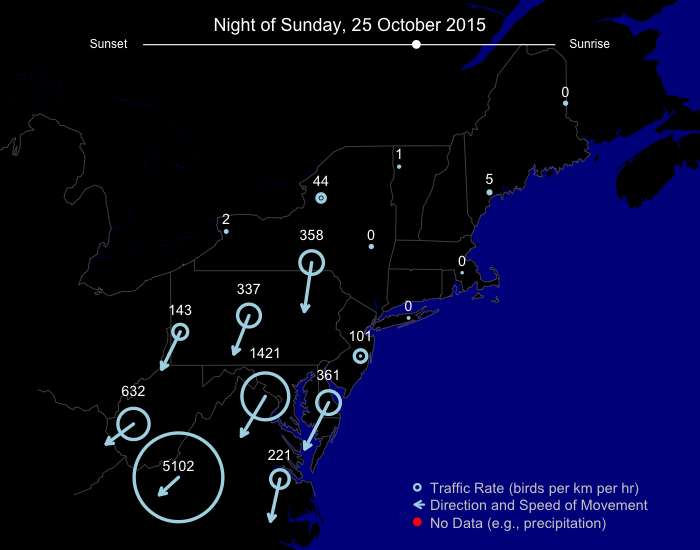
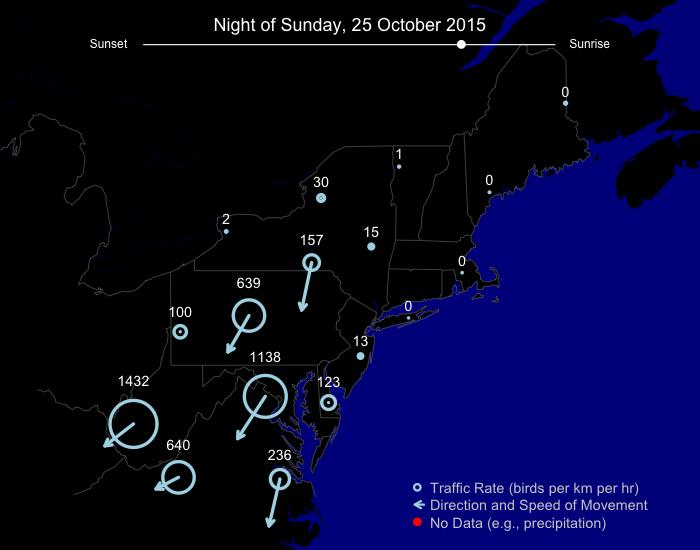
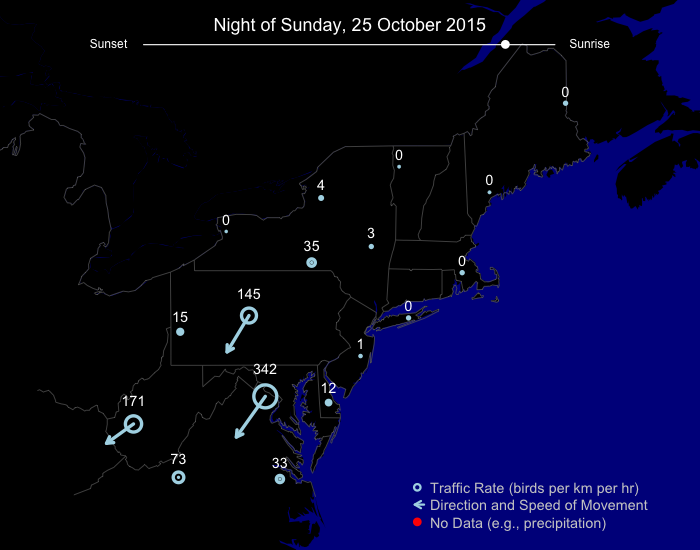
Migration events over the last week varied substantially in size. Last Friday night (23 October) saw a particularly large movement (see below to watch), followed by no (or extremely small) movements on the following night. Successive nights saw decreasing migration traffic rates; remember, a major low pressure system moved through the region with lots of precipitation. Some area are due for another push, which will happen tonight and again very late in the coming week. Remember, migration traffic rate is defined as the number of birds from 0-3,000 meters above radar stations moving hourly over a 1 km line drawn on the ground.
Nightly migration loops
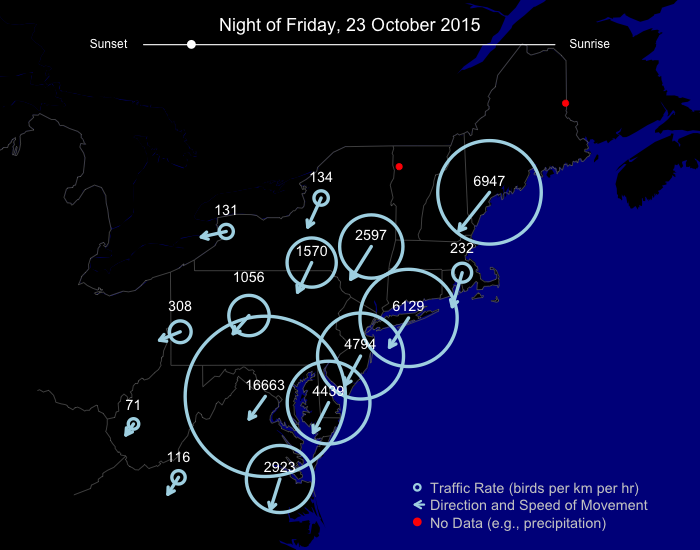
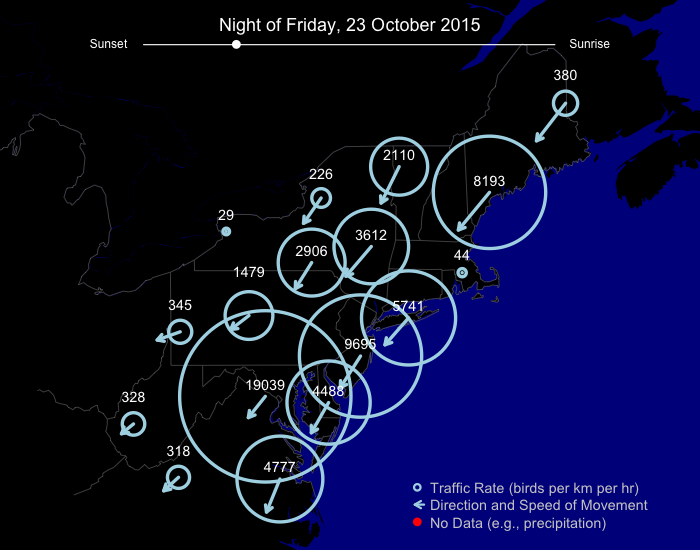
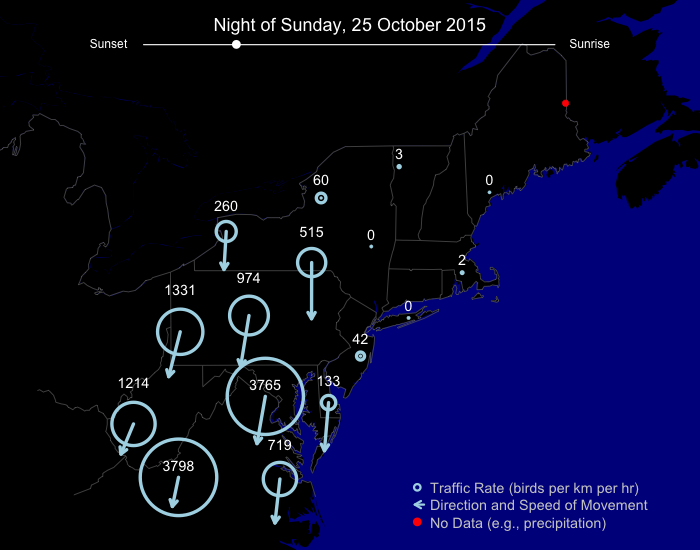
By far the biggest night of migration was last Friday, 23 October.
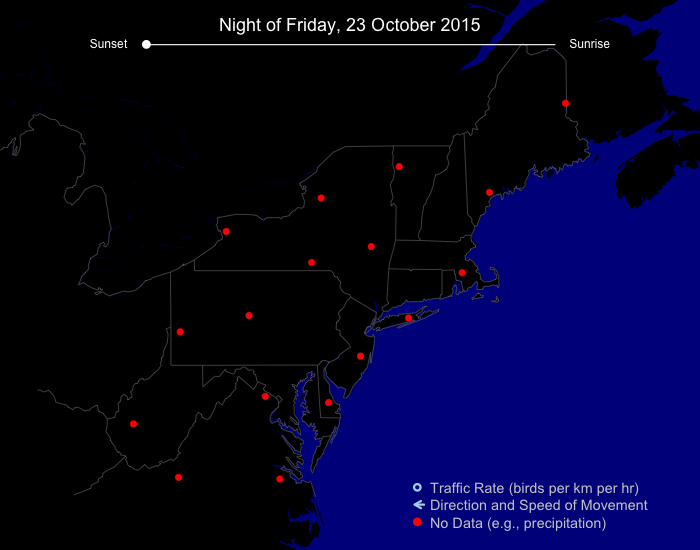
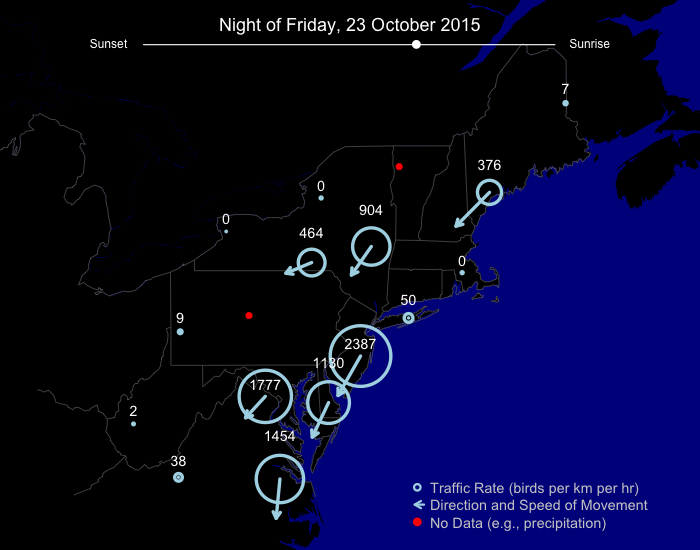
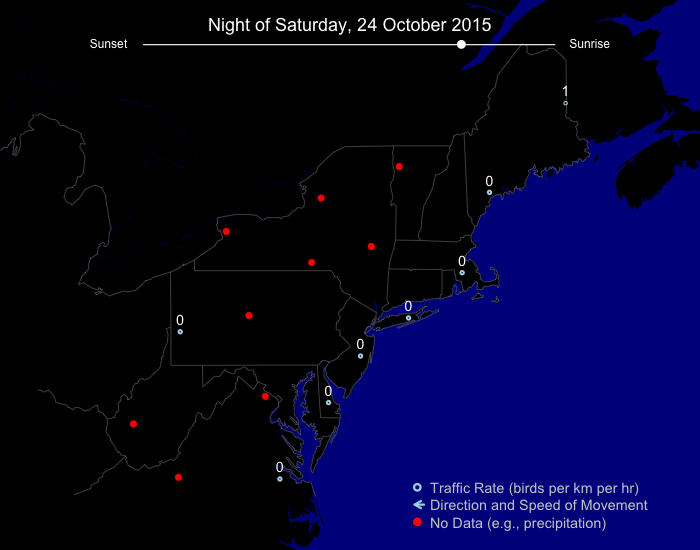
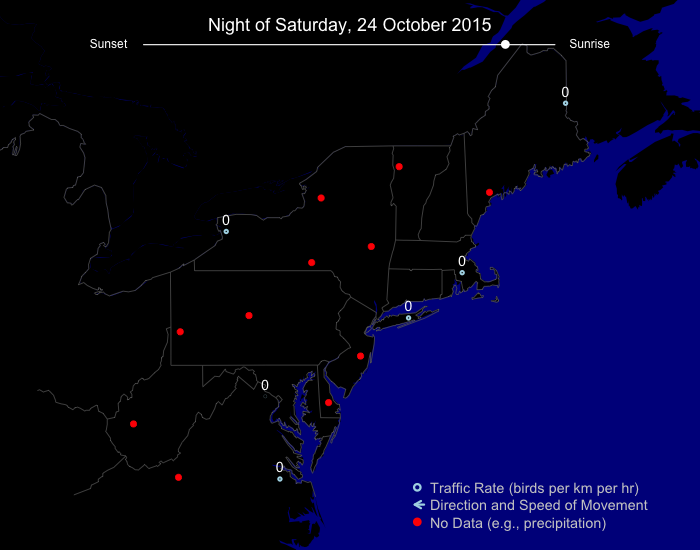
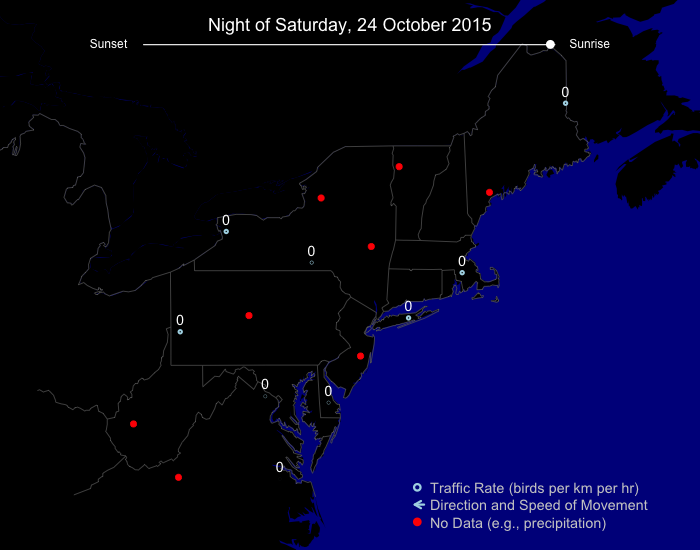
In sharp contrast, the following night (24 October) saw zero birds, although plenty of precipitation!


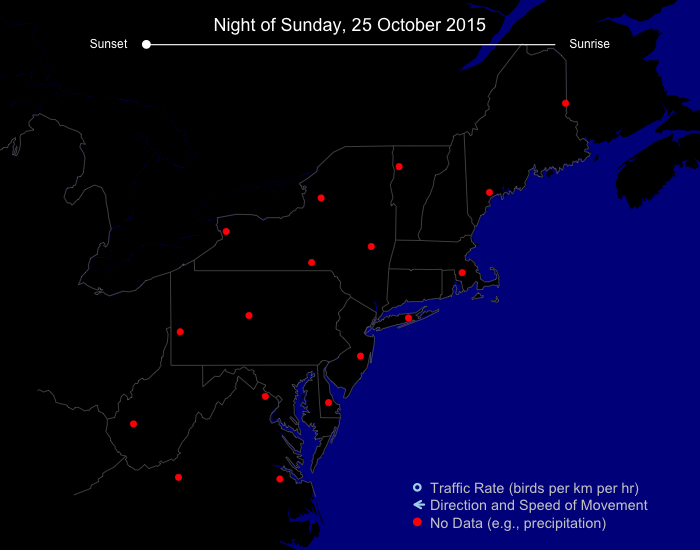
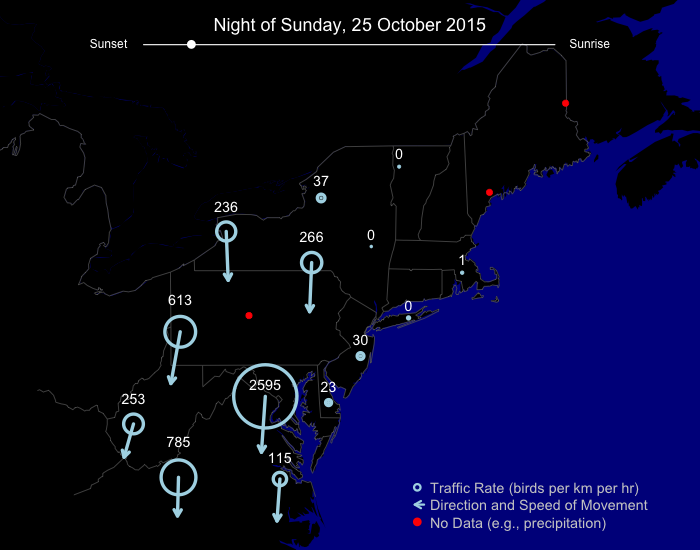
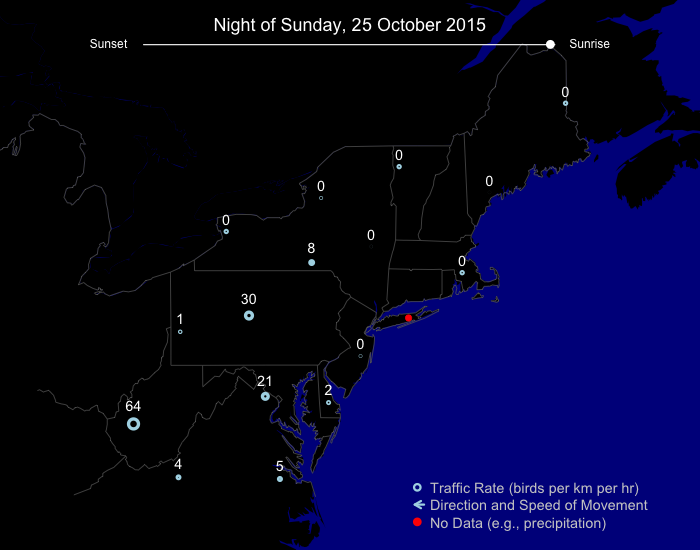
But the birds were back the next night, of 25 October.
For more detailed accounting of what species were migrating during this period, please visit our regional migration analysis for the Upper Midwest and Northeast in which we (as humans not just algorithms!) describe and interpret movements in greater detail.