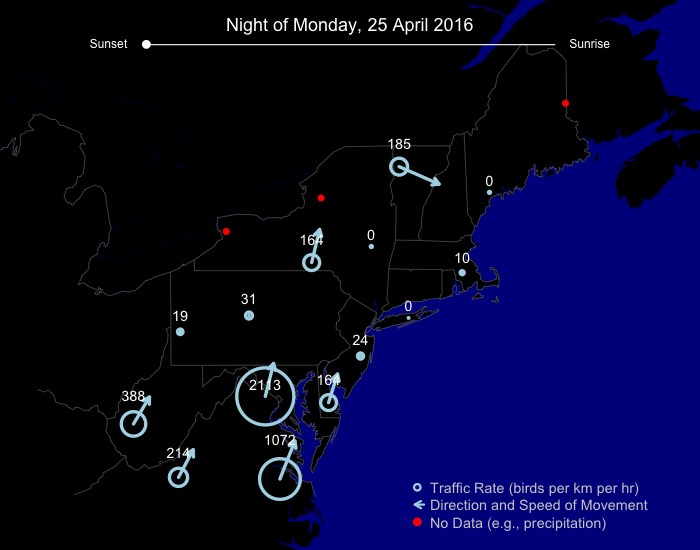
Welcome to this installment of BirdCast Traffic Reports, posts describing northeastern US nocturnal bird migration traffic rates, as calculated from a completely automated pipeline of algorithms. The images you see in Traffic Reports present the migration traffic rate (MTR), direction of bird movement, and speed of bird movement. See our first report or scientific paper (currently a preprint) for more information about the calculations and algorithms we use.
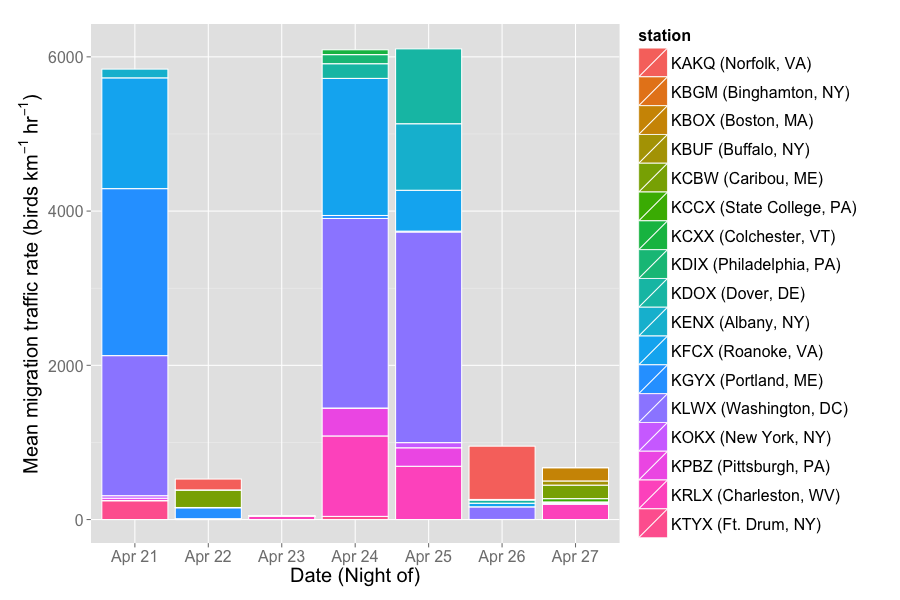
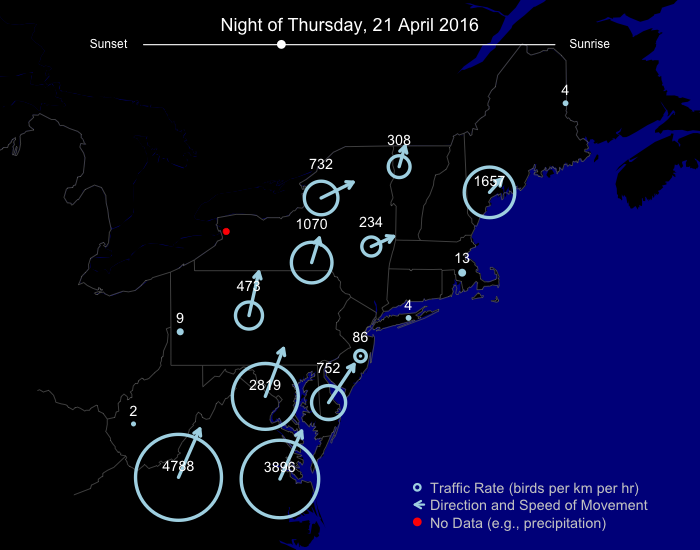
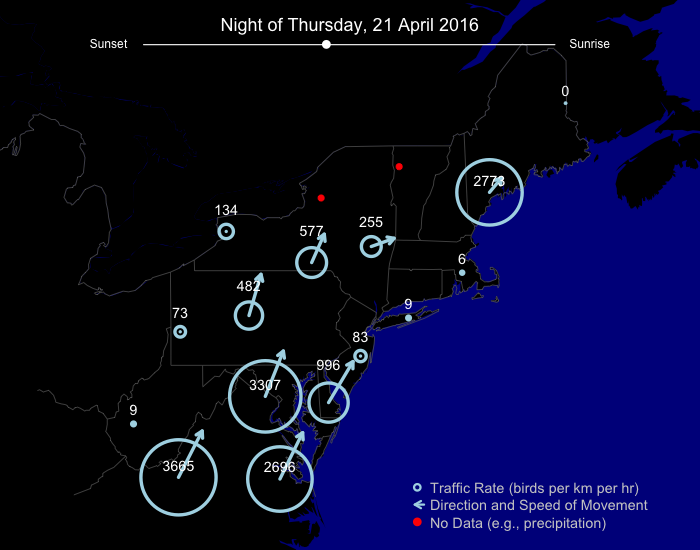
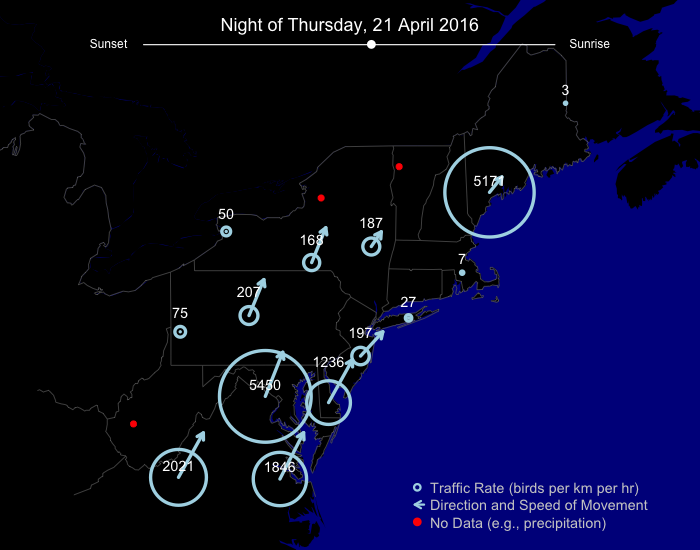
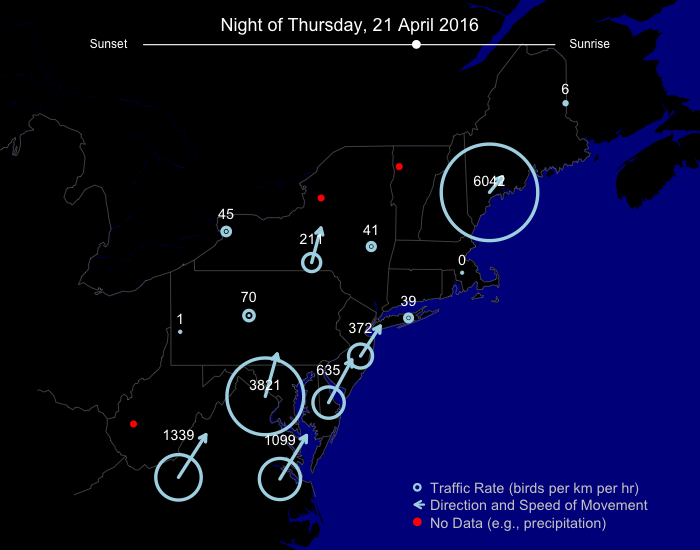
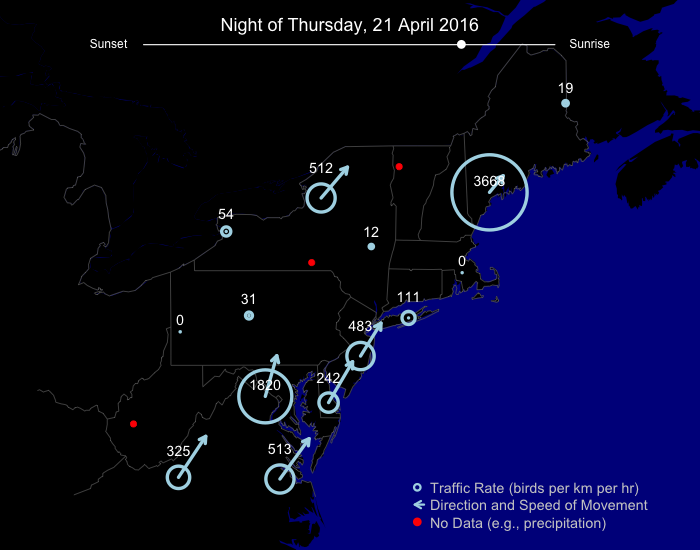
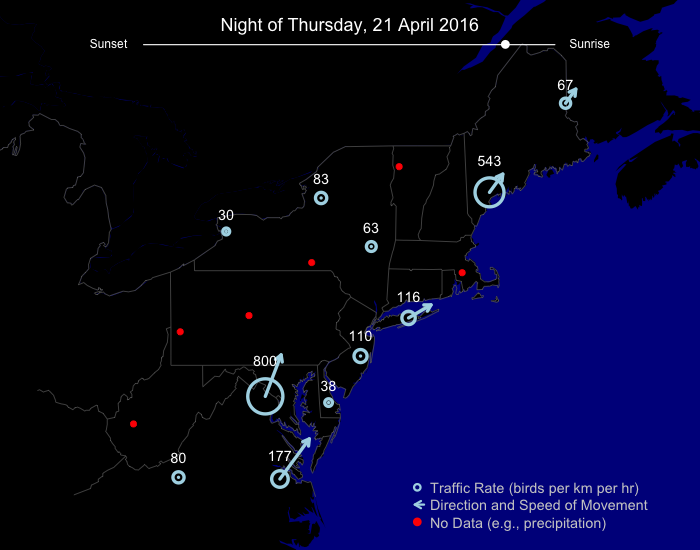
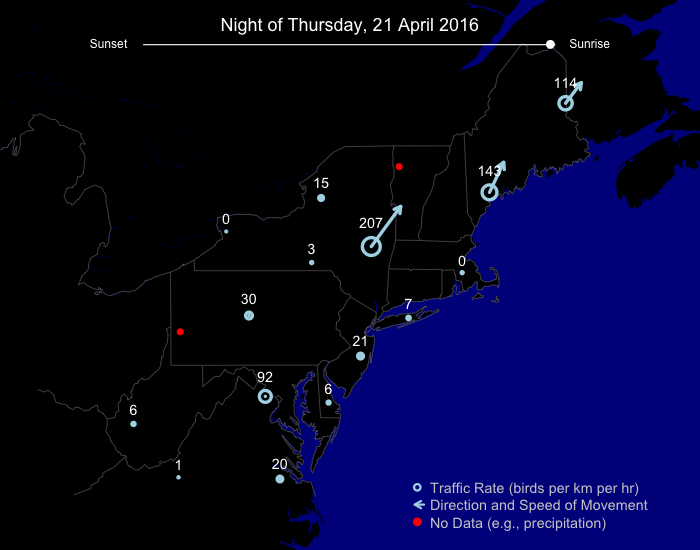
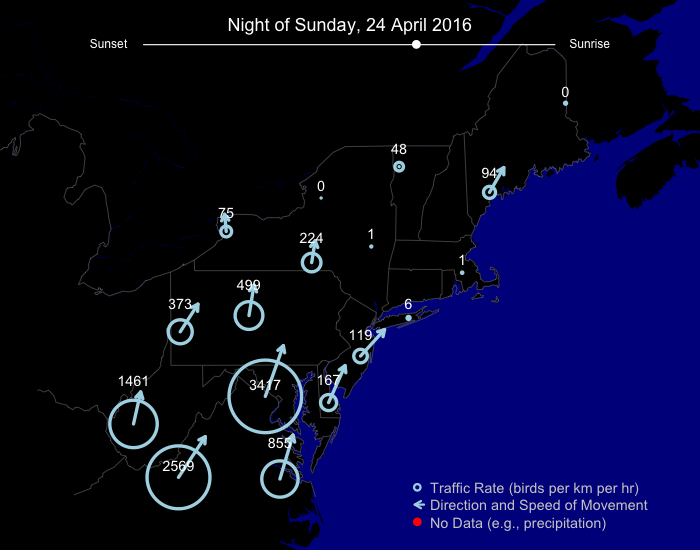
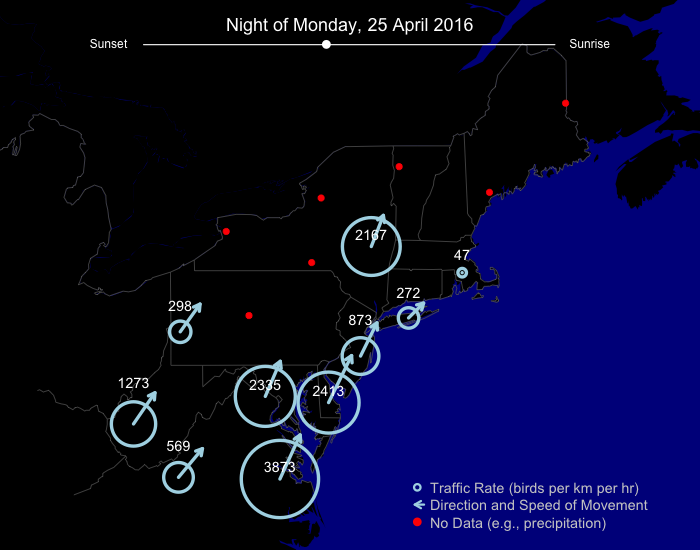
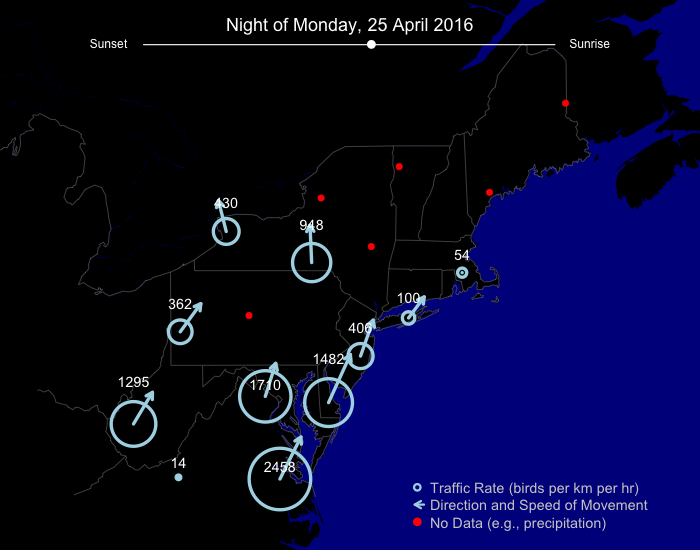
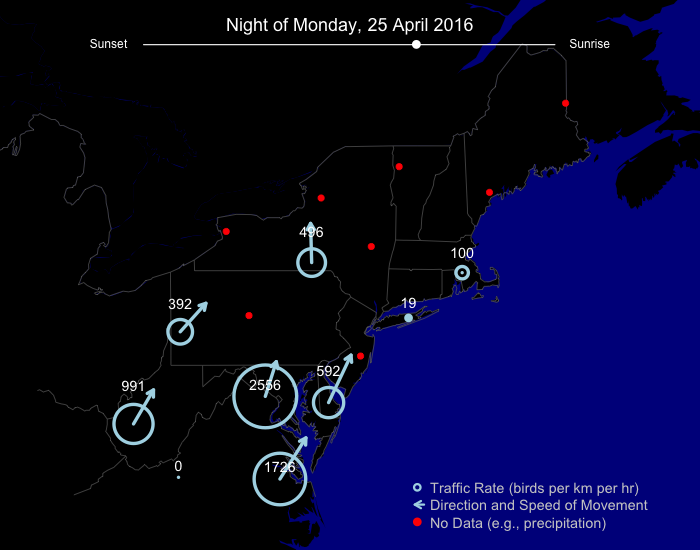
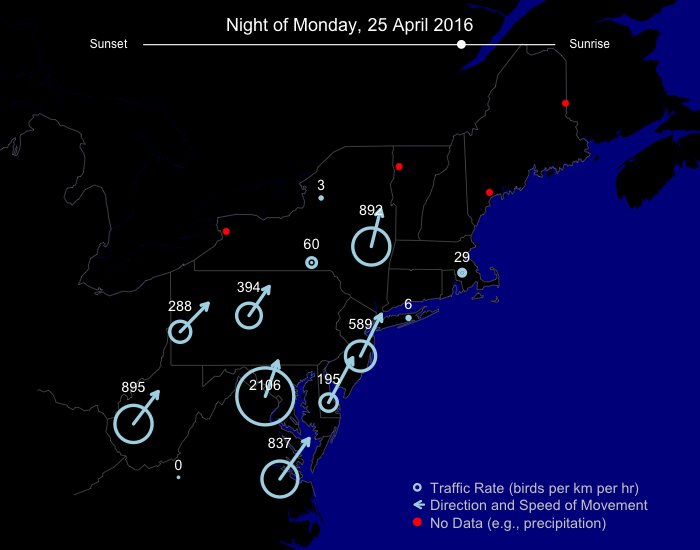
21-28 April was a period with substantially more exciting movements than previous weeks in the northeastern US. Three nights saw more intense flights than almost of the previous weeks combined, 21, 24, and 25 April. The most active areas of the region for migration on these nights were generally south of New Jersey and Pennsylvania, with the biggest flights in Washington, DC and Roanoke, VA. Note that Portland, ME had high traffic, but review of the models showed this to be primarily precipitation and not birds. Remember, traffic, specifically migration traffic rate in our case, is defined as the number of birds from 0-3,000 meters above radar stations moving hourly over a 1 km line drawn on the ground.
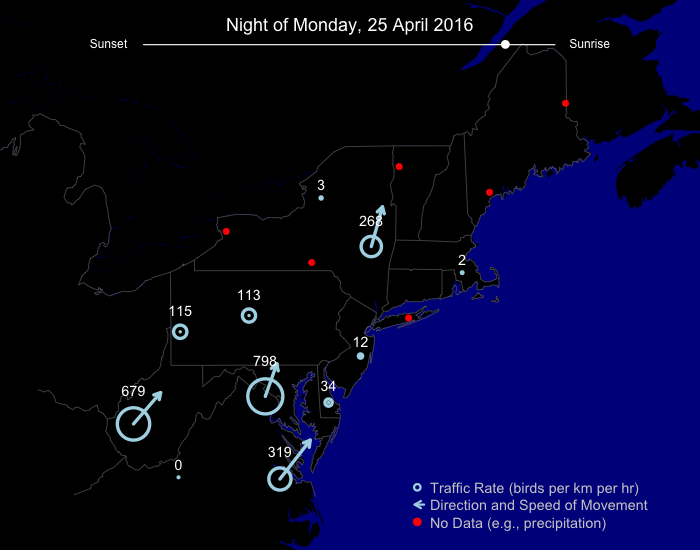
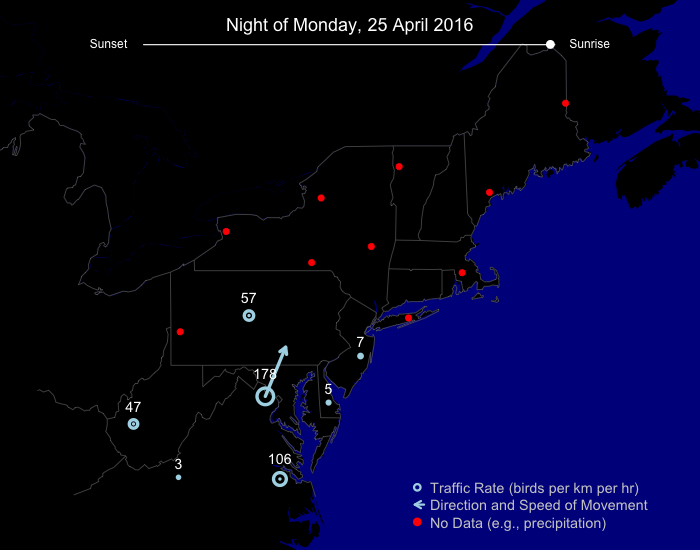
Nightly migration loops
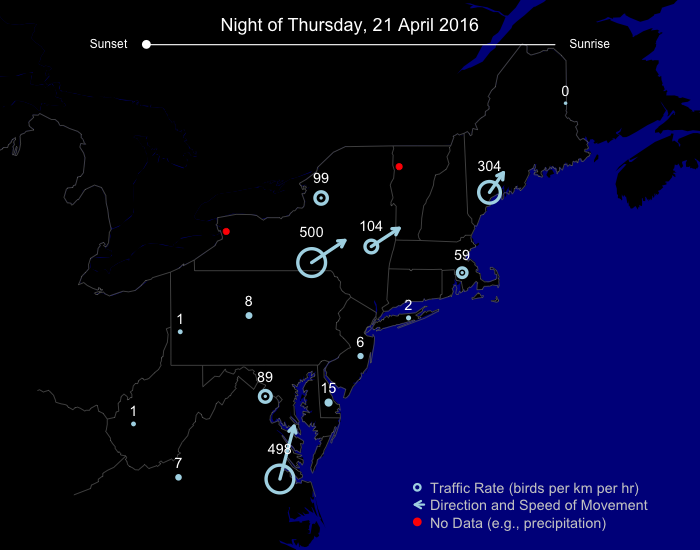
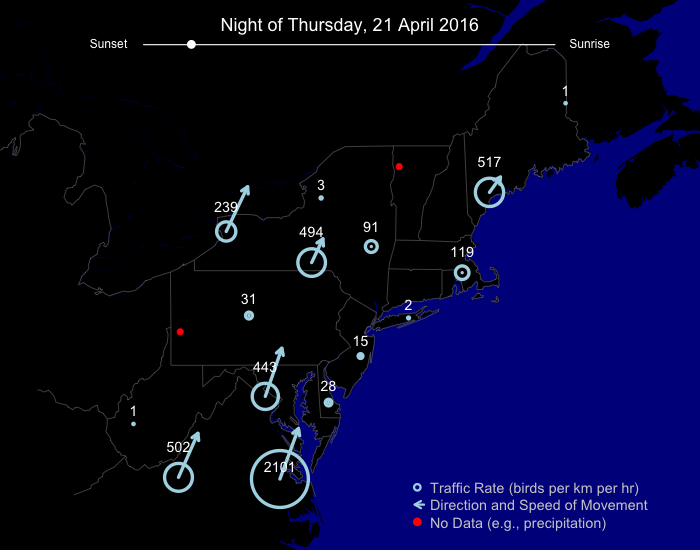
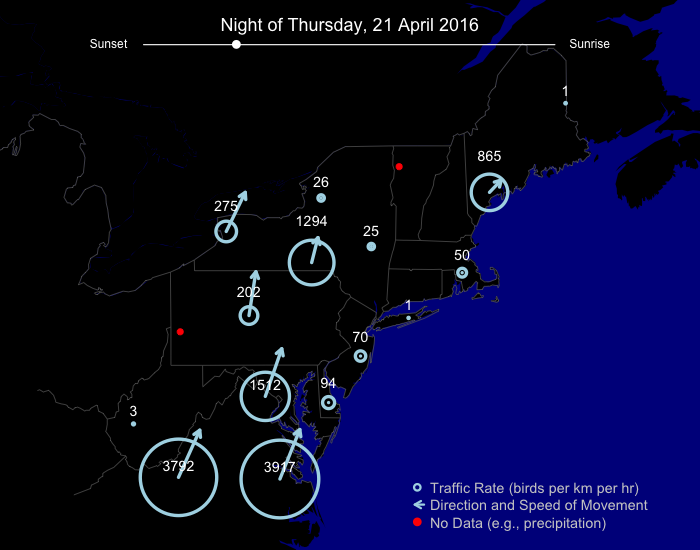
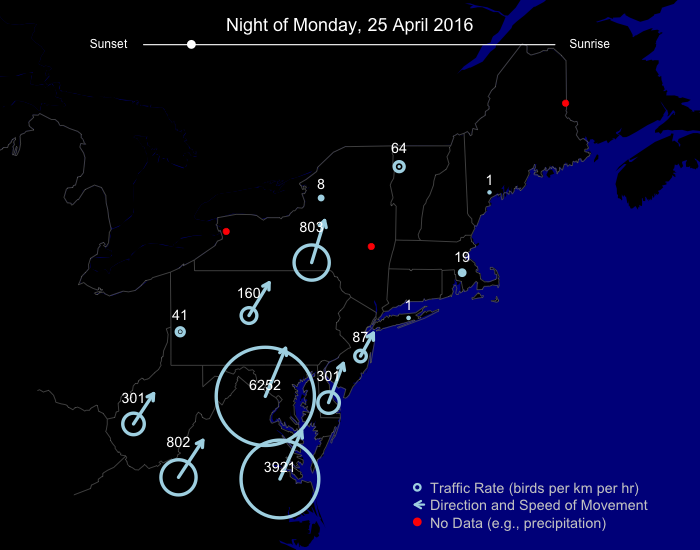
21 April saw the largest flights generally in the southern reaches of the region, with birds moving north northeast across Virginia and DelMarVa. The model incorrectly assigned birds to precipitation farther north, with depicted flights in New York through New England representing incorrectly classified precipitation.
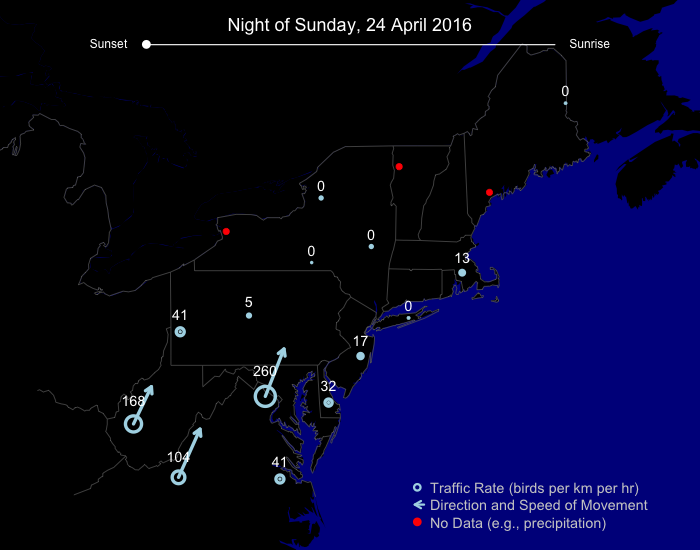
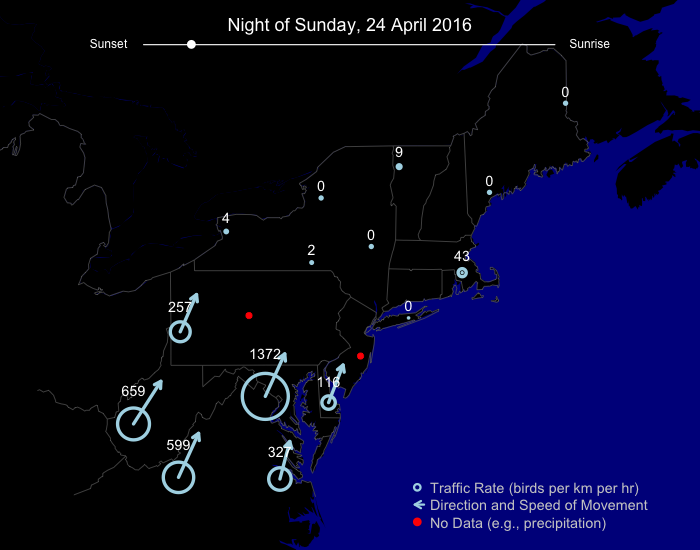
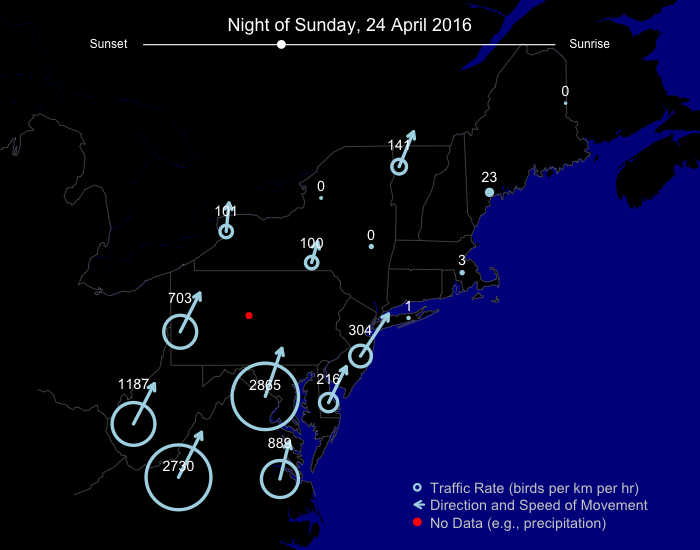
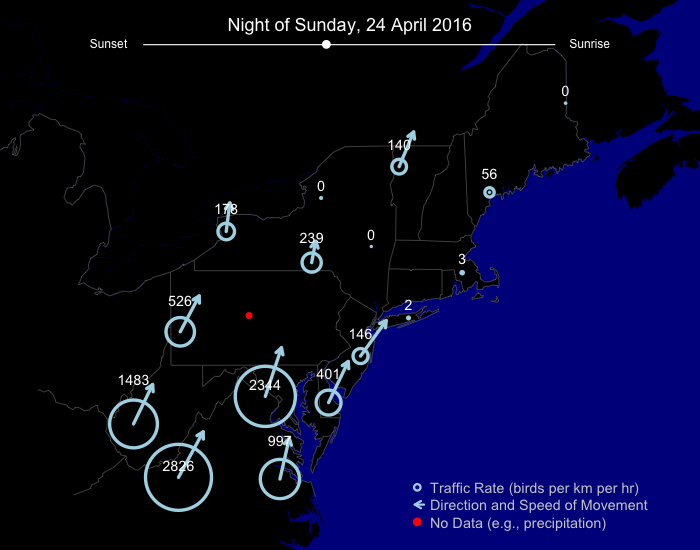
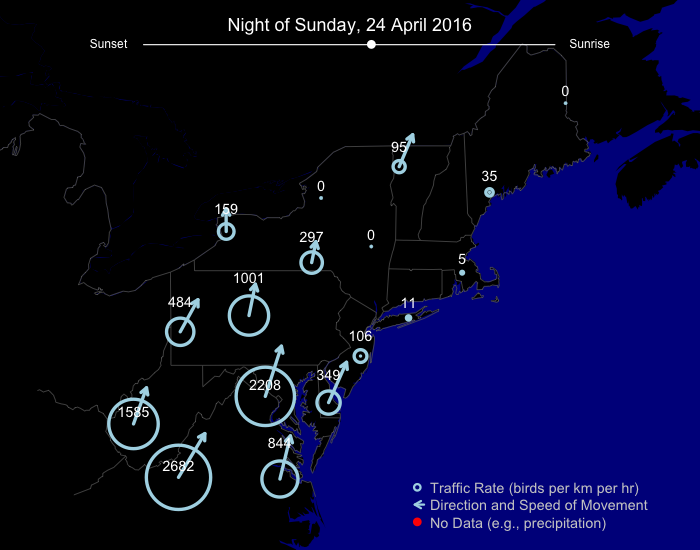
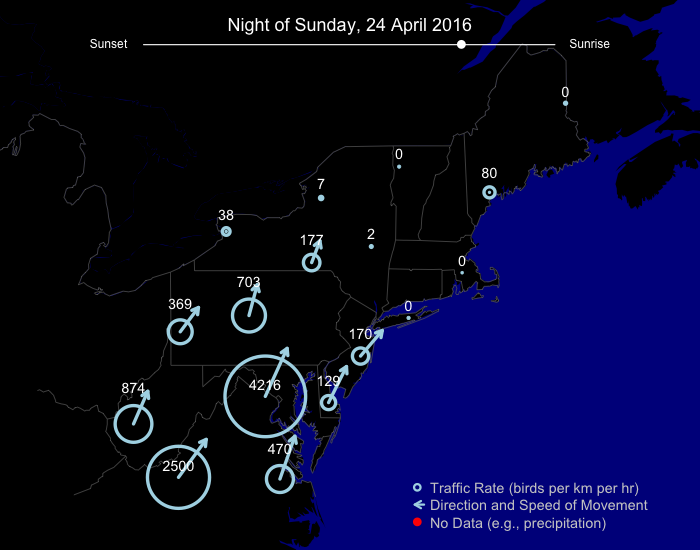
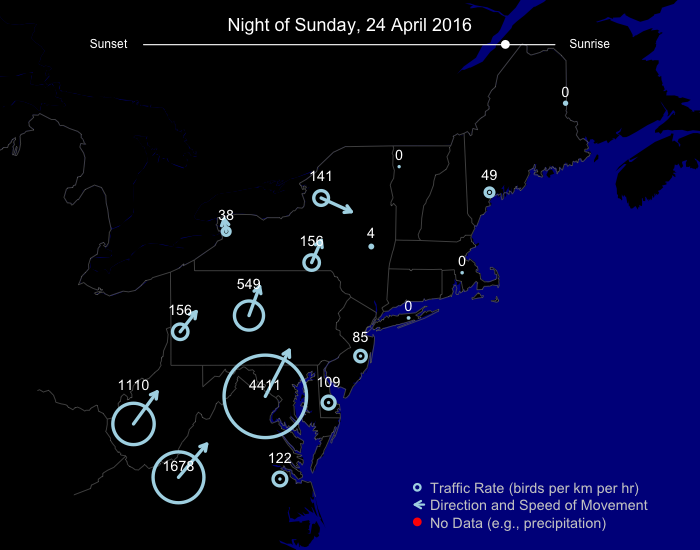
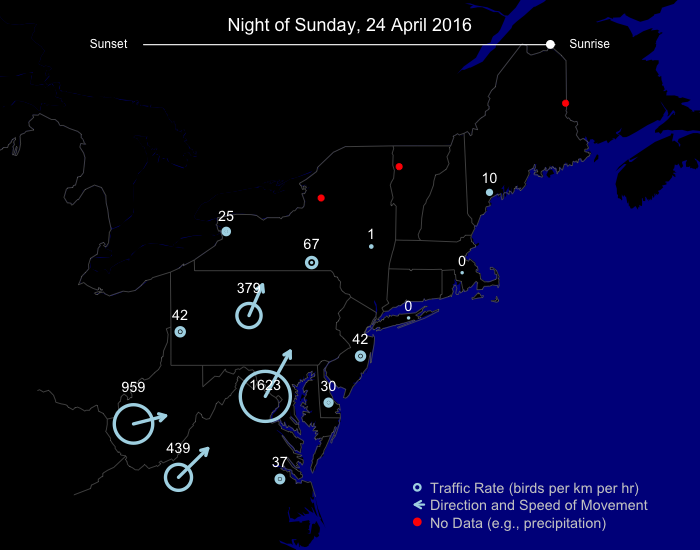
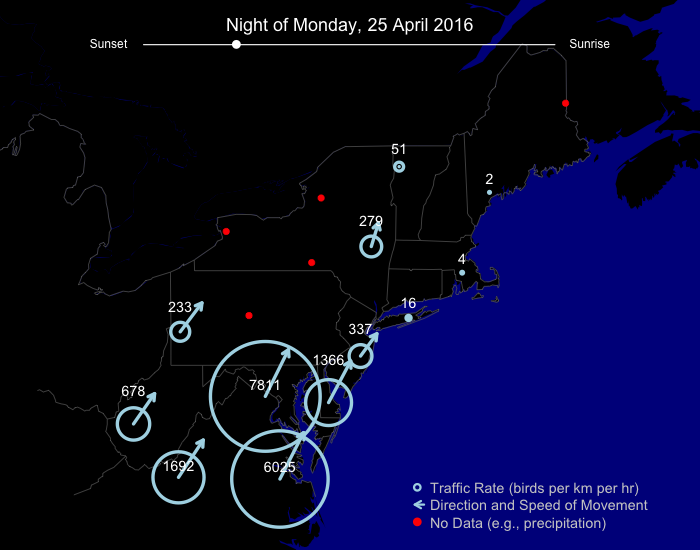
24 April saw continued flights mostly west and south of the Hudson River Valley into the Appalachians. Most birds were moving north northeast.

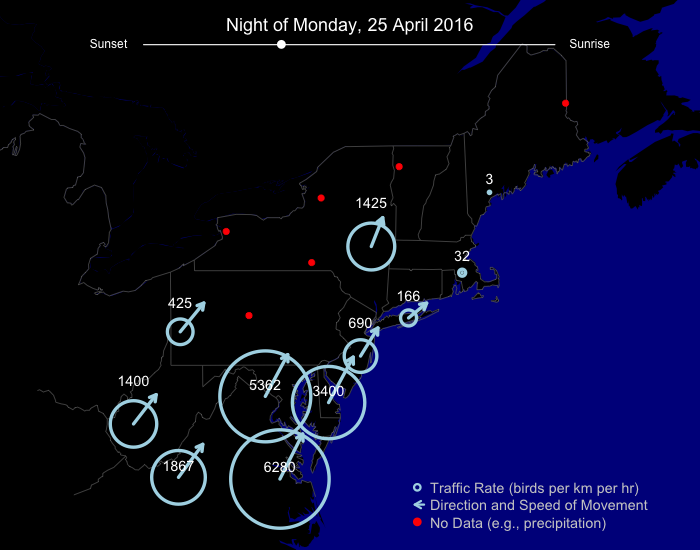
25 April again saw large flights in Virginia, with a similar pattern of traffic and direction of movement at the night of 21 April. Note depicted movements farther north, in New York, represent actually movements of birds in areas free of precipitation.
For more detailed accounting of what species were migrating during this period, please visit our regional migration analyses (here) for the Upper Midwest and Northeast in which we (as humans not just algorithms!) describe and interpret movements in greater detail.