The new BirdCast Migration Dashboard provides summaries of radar-based measurements of nocturnal bird migration, including estimates of the total number of birds migrating, their directions, speeds, and altitudes. This tool depicts migration patterns in near real time or as a summary of a whole night after nocturnal periods end (2021-present); this includes additional historical information (2013-2021) as well as previous nights’ movements. Note that the dashboard currently provides data for counties and states in the contiguous US, complementing our existing forecast and live migration maps but allowing you to explore nocturnal bird migration in ways that were previously impossible. As your explorations begin, discovering interesting, new and previously unknown patterns will be, perhaps, the most exciting aspects of the new tool!
This tool presents a number of different measures of bird migration, and the descriptions below provide some basic information and guidance for interpreting these appropriately. Type in the county or state of your choice in the contiguous United States, select a date during migration seasons in 2021 or 2022, and begin! If you are new to BirdCast, get acquainted with the basics: How to use the BirdCast Migration Dashboard to experience your local migration in detail.
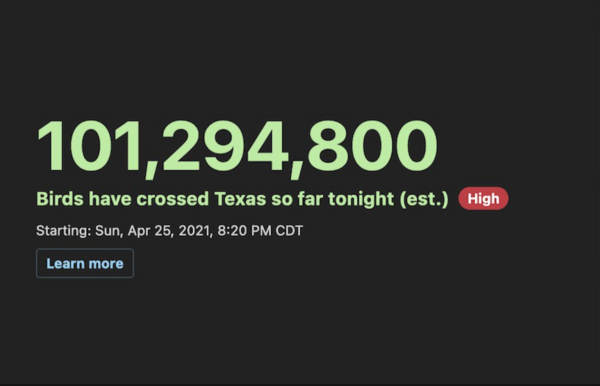
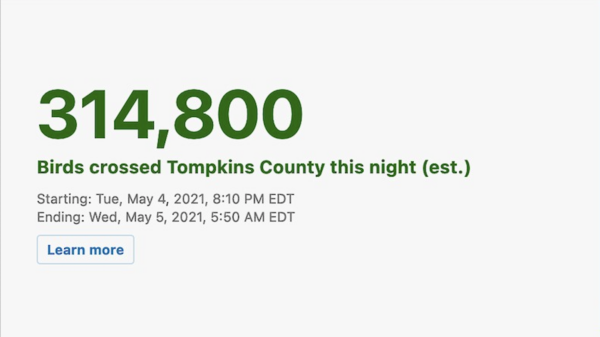
Birds crossed this night
“Live” mode, during nocturnal migration in an active migration season.
“Historical” mode, visible for all time and date selections after the actual migration night.
This counter tracks the total number of birds estimated to have overflown an area since the start of a night (e.g. between local sunset and sunrise). The number increases more quickly when there are many birds aloft and when they are flying at faster speeds. The measure is calculated as the total distance flown by all migrating birds above an area since the start of the night, divided by the average distance to cross the area. The visual shows the start and end times in the US time zone of the selected area, as well as a notation button (in the case above, migration intensity was “High” on this night). This notation employs the same mechanisms and calculations as BirdCast Migration Alerts and Lights Out Alerts that use a threshold to determine high intensity movements for a particular area at a particular time based on comparing live data to historical data.
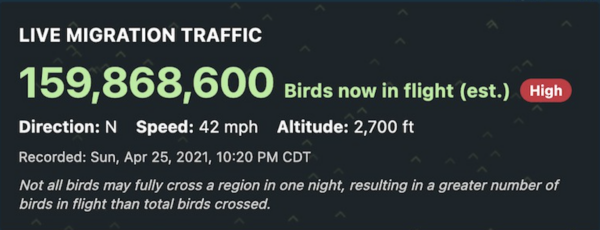
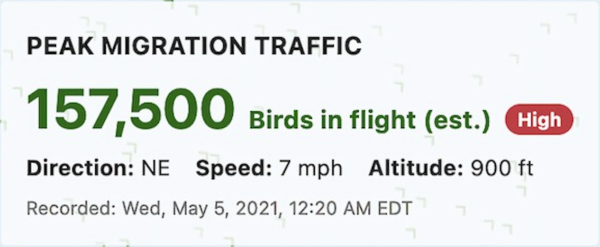
Peak migration traffic
“Live” mode, during nocturnal migration in an active migration season.
“Historical” mode, visible for all time and date selections after the actual migration night.
This is an estimate of the total number of birds aloft in an area (i.e. in a volume bounded by that area up to the highest altitude birds are detected) at the time specified in the local time zone for the selected area. Also reported here are the average direction toward which those birds are moving, their average speed, and their average flight altitude. Nocturnally migrating birds often begin their migration approximately 30-45 minutes after local sunset, with the highest numbers of birds in flight generally occurring in the first half of the night (e.g. usually 2-4 hours after sunset). Peak migration traffic usually occurs in this time period, but its timing within a night varies seasonally and geographically, with potentially dramatic departures from this typical pattern as a result of local and regional weather conditions and migrants’ origins and destinations relative to areas where they cannot land, among other factors. The “High” button in red denotes high intensity migration based on comparisons of live and historical data.
Note: The number of birds in flight may occasionally be greater than the number of birds passed. This seemingly counterintuitive state occurs when birds do not complete a full flight across a selected area, traversing it only partially. To increase the “total birds crossed” number by one (1), a bird would need to fly the full distance to cross the area (which we assume to be on average the square root of the area). As an example, when 100,000 birds take flight simultaneously and fly on average only half the distance to cross an area, the total birds passed will be 100,000 * 0.5 – 50,000 birds, whereas the peak migration traffic, or birds in flight, will be 100,000.
Check out this enormous movement, occurring on 21 September 2021 in Texas, Louisiana, Mississippi, and Alabama.
Birds in flight
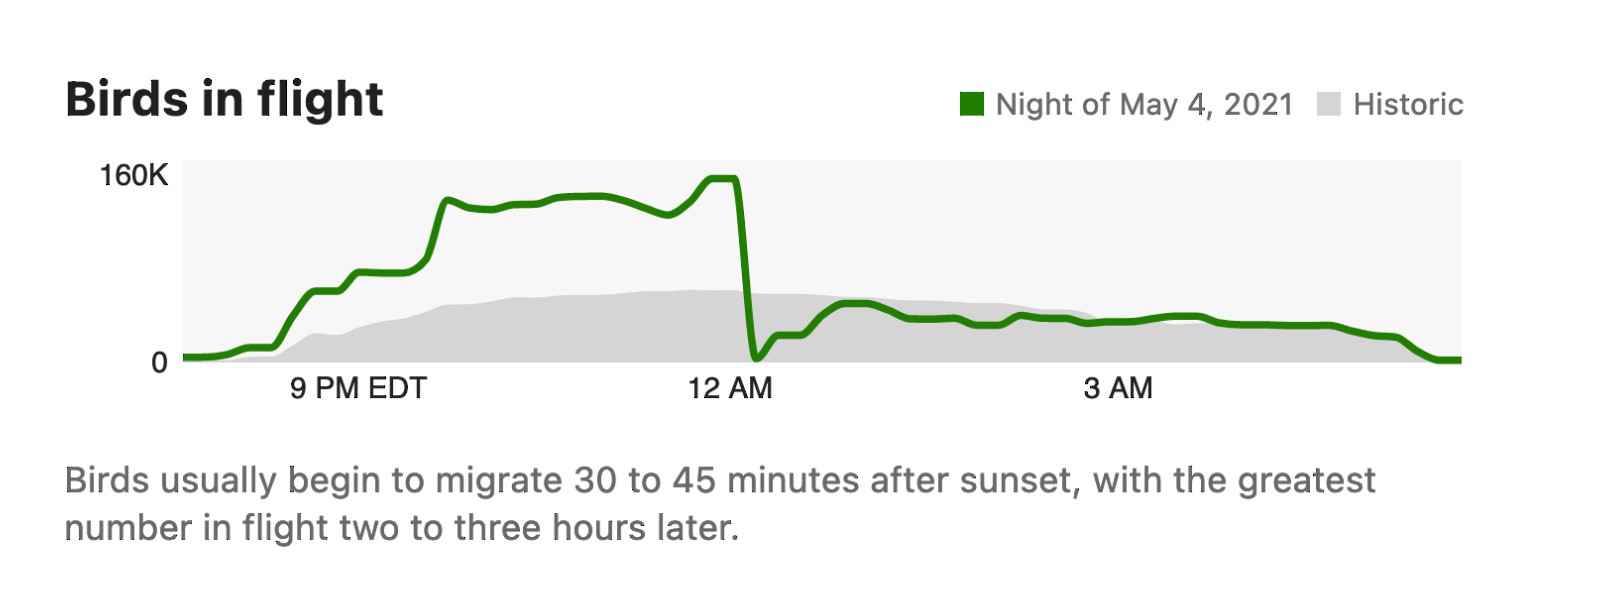
This presentation depicts the pattern of migration traffic over the course of a night, highlighted in green, relative to historical data from 2013-2021, colored gray. The vertical axis shows the total number of birds in flight above the selected region, and the horizontal axis local time in the time zone of the selected area. Nocturnally migrating birds often begin their migration approximately 30-45 minutes after local sunset, with the highest numbers of birds in flight generally occurring in the first half of the night (e.g. usually 2-4 hours after sunset). In these situations, numbers of birds in flight during the second half of the night slowly decrease as birds descend into habitats they will occupy (i.e. in which they will stop over) during daylight hours. However, these patterns vary seasonally and geographically, with potentially dramatic departures from this typical pattern as a result of local and regional weather conditions and migrants’ origins and destinations relative to areas where they cannot land, among other factors. For example, look at patterns in Monroe County, FL, where on the night of 24 April 2021 a pulse of migrant birds departing from local stopover habitat early in the night is followed by a larger pulse of migrants later in the night.
Flight direction and speed
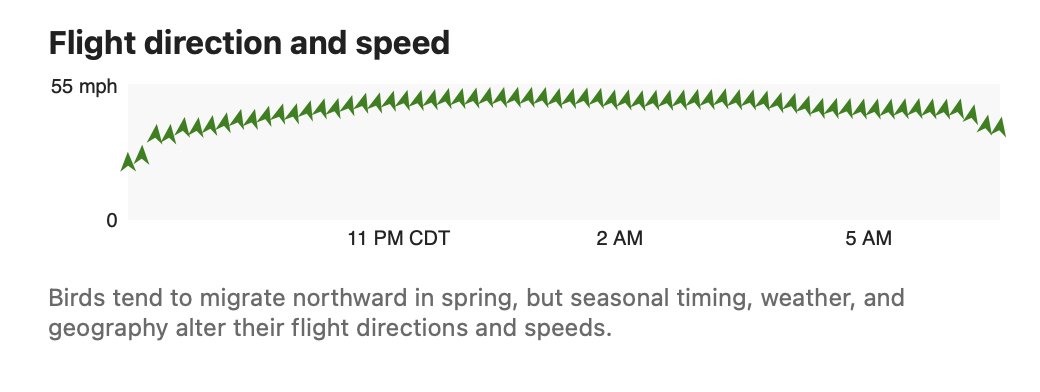 Here, the dashboard shows the flight speed of nocturnally migrating birds, represented on the vertical axis, and the direction toward which they are flying, represented by the arrow icons in the graphic, over local time on the horizontal axis. Birds fly primarily toward northerly directions in the spring and toward southerly directions in autumn. However, above some areas of the US, birds fly much more strongly toward easterly or westerly directions. In all cases, seasonal timing, weather, and geography alter their flight directions and speeds. Additionally, birds may deviate around local and regional severe weather and may alter their flight directions during a night depending on the presence or absence of concentrating features of the landscape below them (e.g. coastlines).
Note: When numbers of birds are low, flight speed and direction calculations may not be possible leading to gaps in data.
Note: Some unexpected directions occur during periods when numbers of birds are low and during precipitation contamination (see 19 April 2021 in Arapahoe County, Colorado). Relatively rapid shifts in flight direction from the predominant migratory direction into the direction of the wind often indicate that non-bird signals are contaminating radar data (see 15 April 2021 in Arapahoe County, Colorado).
Altitude above ground
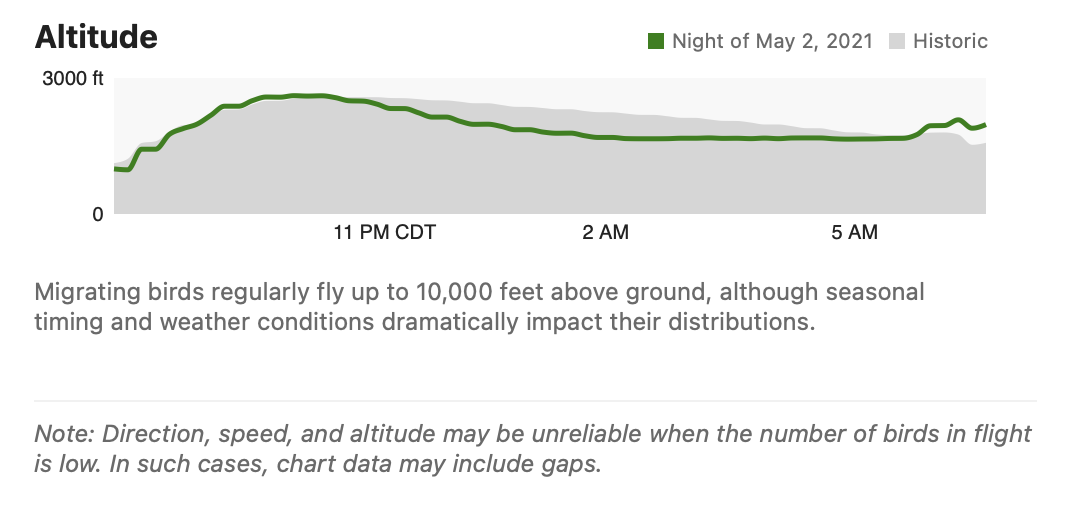
Flight altitudes on the vertical axis, in feet above the ground, over time on the horizontal axis, in green for the selected date relative to historical data from 2013-2021 in gray. Birds generally fly between 100 and 10,000 ft above the ground, though often with a large variation in flight altitude by geography, time of night, and time of season (and even within a night). This graph shows mean flight altitude of migrating birds, so remember that individual birds may fly much higher or lower than this mean. Weather, especially wind direction and speed, has a big impact on how high birds fly. Although patterns of flight altitudes and winds sometimes vary in unexpected ways, birds tend to choose flight altitudes with supportive tail winds, which may occur at very high altitudes; note, this is not always the case, as birds will also fly in calm conditions and even in headwinds. Flight altitudes are presented relative to the ground level. In mountainous regions radar stations may be positioned at relatively high locations and birds may under-fly the radar without being detected. Flight altitudes in mountainous states (e.g. California, Nevada, Oregon, Utah) are therefore less accurate, and we suggest focusing on the relative changes throughout the night and season, instead of on absolute numbers reported in these areas.
Note: When numbers of birds are low, altitude calculations may not be possible leading to gaps in data (for example, see the night of 15 April 2021 in Nevada). Occasionally incorrect altitudinal patterns may be detected that are not necessarily representative of birds’ flight altitudes, especially during periods when numbers of birds are low, when precipitation contaminates the signals, or during occasional insect emergences or other anomalous atmospheric conditions that may lead to spurious patterns of altitudes.
Birds in flight (nightly average)
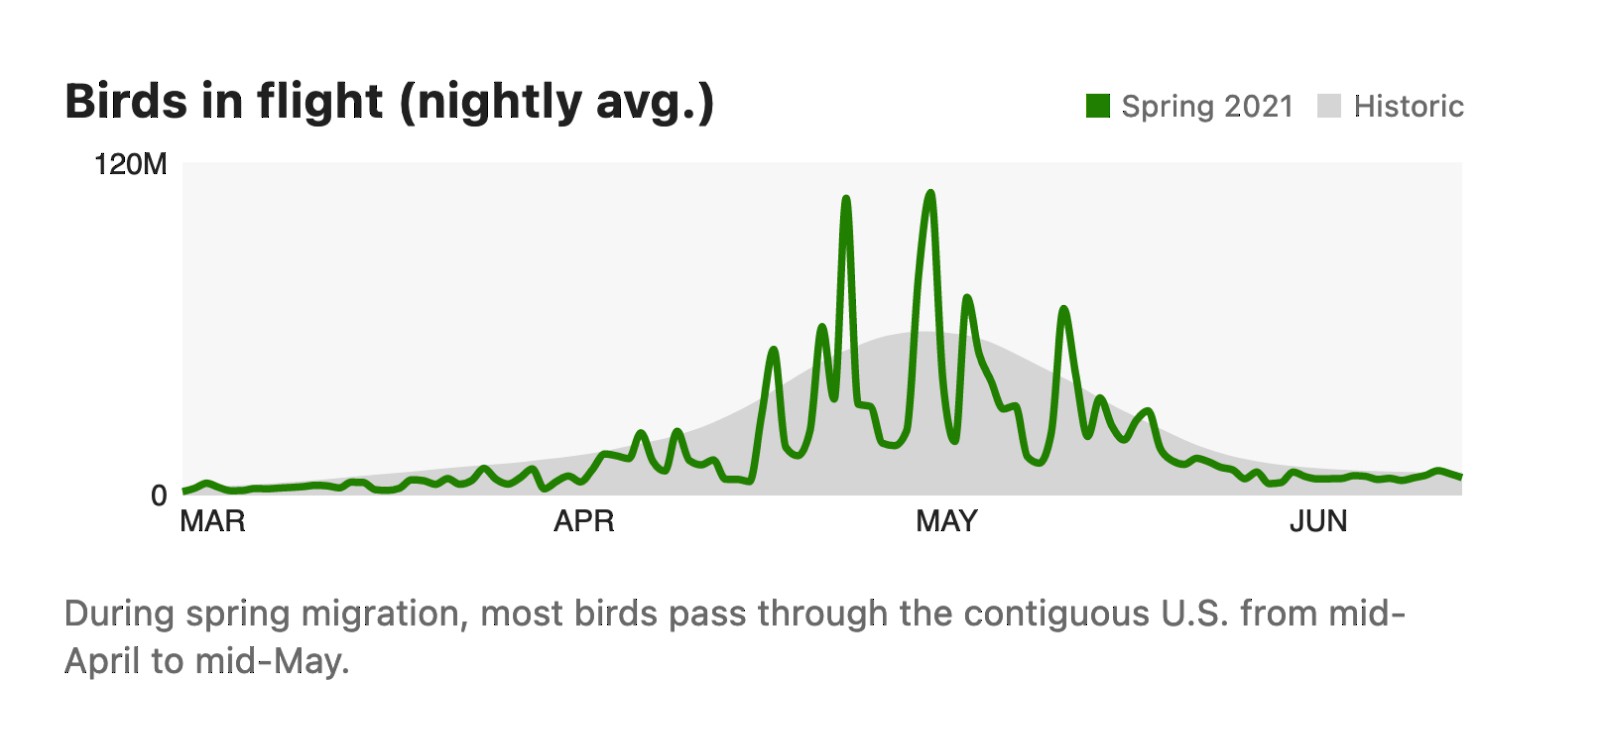 This graph shows the average number of birds in flight for each night for the migration season in which a particular selected date occurs (i.e. spring 2021 in this case) in green relative to historical patterns from 2013-2021 in gray, revealing longer seasonal trends. A vertical bar highlights the specific date selected representing other nightly migration measures. Most nocturnal bird migration in spring occurs from mid March to mid June, with the greatest numbers of birds passing through the contiguous US from mid-April to mid May. Most nocturnal bird migration in autumn occurs from mid August to mid November, with a peak migration period in the contiguous US from early September through October. The current season’s data often show distinct peaks for nights with high migration, followed by nights with low migration. The historical average changes much more smoothly over time, as the yearly peaks are averaged.
Total birds crossed
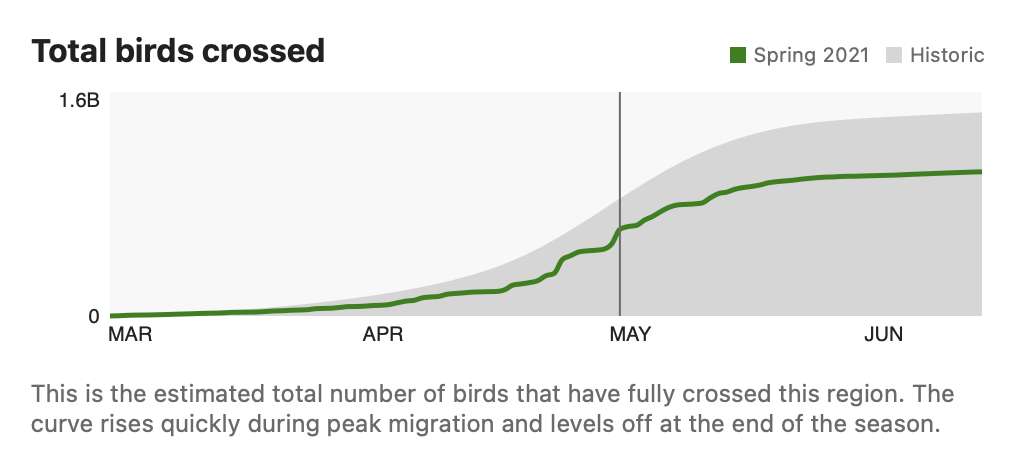 This measure indicates the total number of birds that has overflown the area from the start of the night migration season. This cumulative measure rises quickly during peak migration, when many birds overfly the region. It levels off at the end of the migration season at the total number of birds that has crossed the region during the full migration season. It is calculated as the total distance flown by all migrating birds above the given area, divided by the average distance to cross that area, for the season to date (green); it is presented relative to historical data (2013-2021, gray). A vertical bar highlights the specific date selected representing other nightly migration measures.
Note: At equal migration intensities, the total birds metric increases more quickly for smaller areas than for larger areas. This is because it takes birds less time to overfly a small area. The cumulative curve rises most steeply during peak periods of nocturnal bird migration, and levels at the end of the migration season, at which point the curve indicates the total numbers of birds that have passed over the region during the entire migration season.
Expected nocturnal migrants
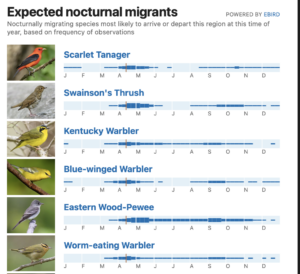
A partial list of nocturnally migrating species most likely to arrive or depart in Texas on 14 April, based on frequency of observations.
This presentation shows nocturnally migrating species most likely to arrive or depart a selected region at this time of year on a weekly basis, based on frequency of observations from eBird. Note, there will be some periods when we do not have sufficient data to calculate this list.
This list does not represent all possible species of migrating birds in a given region, rather those based on a selected county or state and date with a frequency of occurrence greater than 0.01, in 12 weeks or fewer during the year, with fewer than six weeks across the year of zero frequency for a week, and for species with the highest absolute changes in frequencies between the selected and prior weeks.
Note: This list contains almost exclusively birds that migrate nocturnally, meaning species that are likely to occur in nightly or historical radar data; this list will not contain many additional species that may be quite common migrants, by day, including many swallows, blackbirds, raptors, and some waterbirds. Further, this list contains species that are arriving and departing, that is to say increasing frequency between weeks and decreasing frequency between weeks. Additionally, the initial criteria to develop this list may not exclude all resident, vagrant, or exotic species that may be present in the region at the selected time.
This is an experimental tool, and we recognize that because of the vagaries of observers’ habits, migration timing and amount, and geographic variation that not all locations have sufficient data for our data-driven approach to render a meaningful species list that captures the diversity of nocturnally migrating birds. Moreover, our approach does not include any information about counts or relative abundance, a suite of criteria that we would like to employ in the future.
Off-season state
The BirdCast Migration Dashboard data feed is live from March 1 to June 15 in spring and August 1 to November 15 in fall. Live data feed begins each night at sunset and ends each morning at sunrise during migration season. Live migration data are not available outside of these seasonal and temporal windows, but you may browse historical data for any migration dates in 2021 during inactive periods.
Inspiration for explorations!
There are countless ways to explore patterns in the new dashboard, and here is an idea to kickstart your investigations:
17-20 April 2021 – let’s look at the statewide dashboard, for example, for a nice flight night on 19-20 April 2021. This is not the biggest flight of the spring, but it is the first large flight in the peak period of migration when on average half of the total spring bird migration passes through Texas in just 2-3 weeks! Let’s look a little more closely at the nights preceding this flight to see some additional detail, especially for excellent coastal birding locations in Galveston and Jefferson Counties, Texas. Here are checklists submitted on 17 April 2021 from High Island, Texas, a legendary stop for those seeking to experience migration along the Gulf of Mexico coast: among the many hotspots to visit, see Hook Woods, Smith Oaks, and a watch on the barrier beach (with active migration occurring). Check out the dashboard for the 16-17 April night in this area and find an interesting pattern of pulsed migration – and a none too overwhelming intensity – within the night preceding a shutdown. Very little activity follows on the next night, 17-18 April, despite good activity on the ground from lingering migrants in places like Hook Woods. But by 20 April, with continuing good birding in migrant spots like Sabine Woods in Jefferson County, it’s clear that some significant movements on the previous night yielded some new arrivals. This story is, of course, far from complete, because we have not discussed any weather conditions that might have impacted movements in this time – here’s a hint, check out this story to understand a little more of the dynamics and the potential explanations! Quiz comes later …